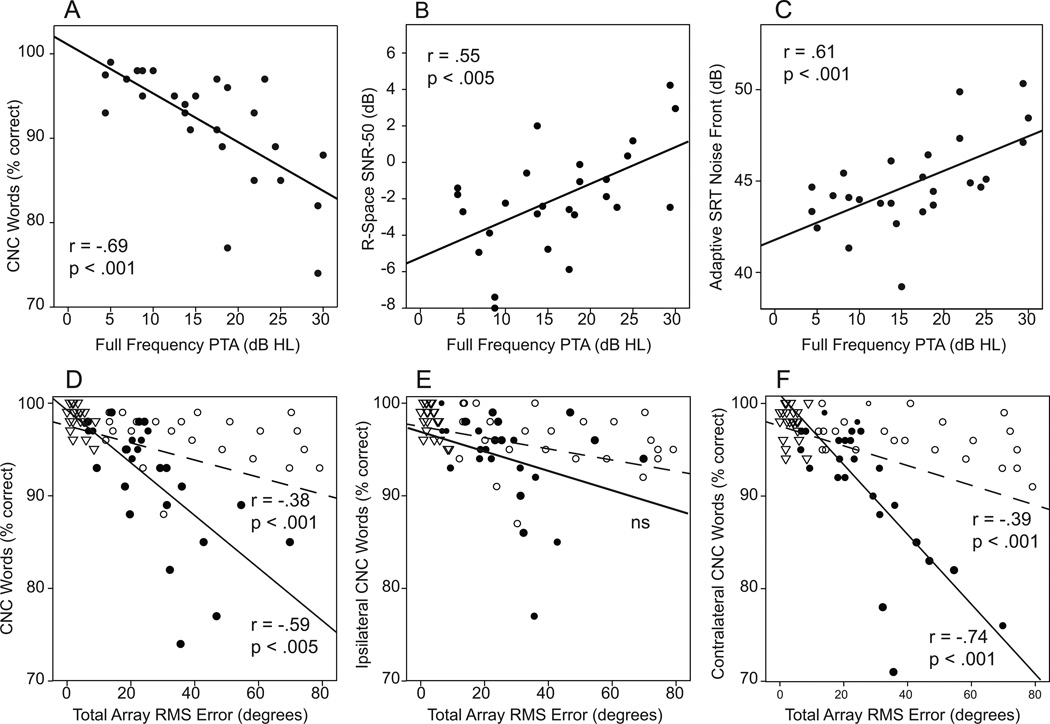
Figure 8.
Scatter plots depict correlations for hearing levels in the better ear and localization ability or speech-recognition measures. The top row plots show the relation between better ear hearing (full-frequency pure tone average) and CNC word recognition (Panel A), R-Space SNR-50 (Panel B) and Adaptive SRT with noise from the front (Panel C) for unilateral hearing loss (UHL) participants. The bottom row plots demonstrate the relation between localization ability (RMS error with the total array) and CNC word recognition when words were presented across the total array (Panel D), from the loudspeakers ipsilateral to the open/right ear (Panel E) and from loudspeakers contralateral to the open /left ear (Panel F). Participant groups are indicated by filled circles for UHL, open circles for NH-unilateral, and open triangles for NH-bilateral. Regression lines for the UHL group are solid and for the entire group of participants are dashed. Correlations for each are indicated near the regression lines.

