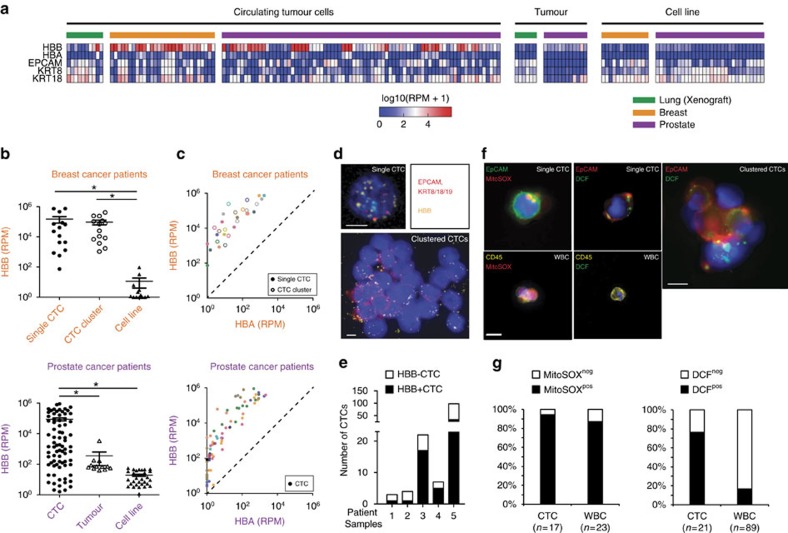
Figure 1. Elevated expression of HBB is detected in circulating tumour cells.
(a) Heat map showing relative expression of haemoglobin genes (HBB and HBA) and epithelial lineage genes (EPCAM, KRT8 and KRT18) in single CTCs and clustered CTCs (lung, n=10; breast, n=29 and prostate, n=77), primary tumour samples (lung, n=6; prostate, n=12), and established cancer cell lines (breast, n=13; prostate, n=4). Data are derived from single-cell RNA sequencing (see Methods). (b) Scatter plot showing increased expression of HBB in single CTCs or CTC-clusters isolated from clinical blood samples of patients with metastatic breast or prostate cancer, compared with single primary tumour cells and/or established cancer cell lines. Data are represented as mean±s.e.m. *denotes P<0.05 (t-Test). (c) Scatter plot demonstrating the specific upregulation of HBB but not HBA in CTCs of breast and prostate cancer patients. Each colour represents a different patient. (d) Representative fluorescence images (× 40) of RNA-in situ hybridization of a single prostate CTC and a prostate CTC-cluster show expression of HBB (yellow dots), and the epithelial lineage markers, EPCAM and KRT8/18/19. DNA is stained with 4′, 6′-diamidino-2-phenylindole (blue). Scale bar, 10 μm. (e) Quantitation of RNA-in situ signal defining HBB-negative and HBB-positive CTCs from a cohort of 5 patients with advanced prostate cancer. (f) Representative fluorescence images of DCF or MitoSOX staining of a single prostate CTCs or CTC-clusters. Prostate CTCs were identified by EpCAM staining, and white blood cells (WBCs) were identified by CD45 positivity. DNA is stained with DAPI. Scale bar, 10 μm. (g) Quantitation of fluorescent signal defining MitoSOX-positive and DCF-positive CTCs and WBCs from a cohort of 5 patients with advanced prostate cancer. The total number of cells analysed is indicated.

