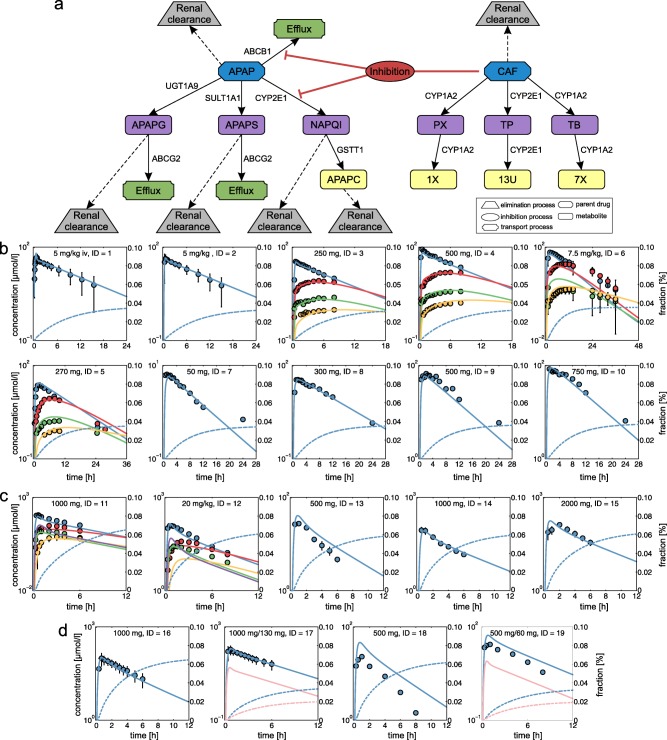
Figure 2.

Physiologically based pharmacokinetic (PBPK) model development and validation. (a) Reaction diagram of twenty‐one biochemical processes implemented in the PBPK models of acetaminophen (APAP) and caffeine (CAF) illustrating active drug transport (green), metabolizing reactions for phase I (purple) and phase II (yellow) metabolites, kidney plasma clearance (gray), and inhibition processes (red). Metabolic enzymes and transporters are shown next to the respective reaction. (b) PBPK model of CAF (CAF = blue, PX = red, TB = green, TP = yellow). (c) PBPK model of APAP (APAP = blue, APAPG = red, APAPC = green, APAPS = yellow, NAPQI = purple). (d) PBPK model for single administration of APAP and for co‐administration of APAP and CAF (APAP = blue, CAF = pink). Simulated drug concentration‐time curves (lines) were assessed with experimental PK profiles (circles). Renal excretion rates were additionally simulated for APAP and CAF (dashed lines). Study IDs and dose levels of the experimental data are shown within each plot (Supplementary Table S5). APAPC, acetaminophen cysteine; APAPG, acetaminophen glucuronide; APAPS, acetaminophen sulfate; NAPQI, N‐Acetyl‐p‐benzoquinone imine; PX, paraxanthine; TB, theobromine; TP, theophylline; 13U, 1,3,dimethyluric acid; 7X, 7‐methylxanthine; 1X, 1‐methylxanthine.
