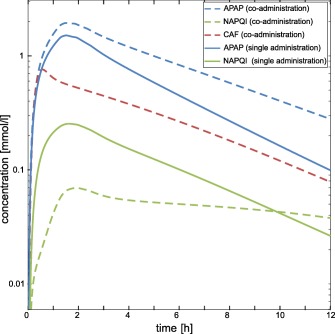
Figure 3.

Pharmacokinetic (PK) simulations for single administration of acetaminophen (APAP) and co‐administration of caffeine (CAF). Plasma concentrations were simulated for APAP (blue) and NAPQI (green) following a single toxic dose of APAP (solid lines) and a co‐administered dose (dashed lines) of APAP and CAF (red).
