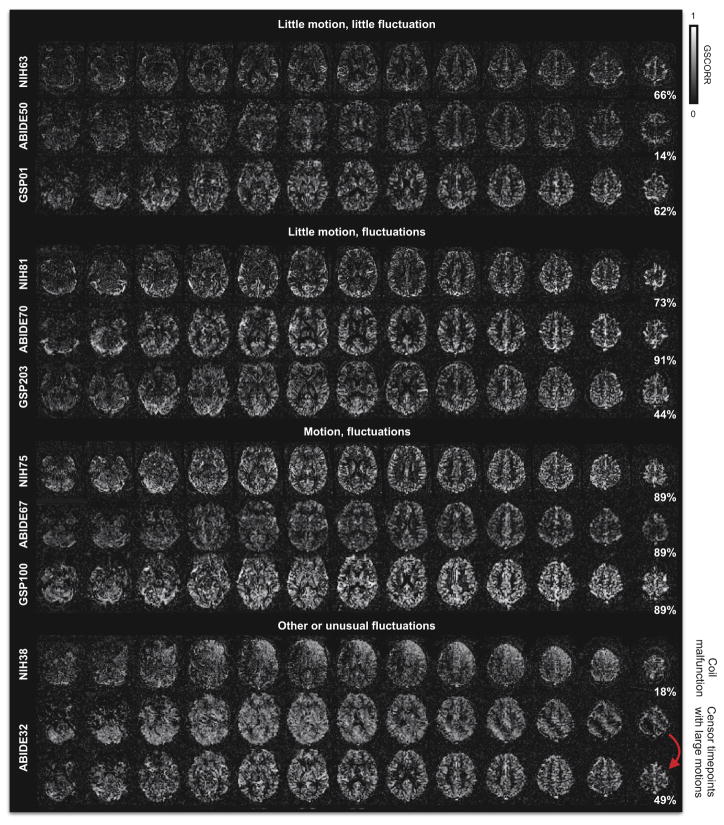
Figure 3. Spatial distribution of global signals.
For several scans of Figure 2, maps are shown of each voxel’s correlation with the global signal (GSCORR). The first 3 subjects exhibit minimal fluctuations, the next 3 exhibit obvious fluctuations, the next 3 exhibit obvious fluctuations and head motion, and the final maps show examples of global signal distributions that reflect artifact.

