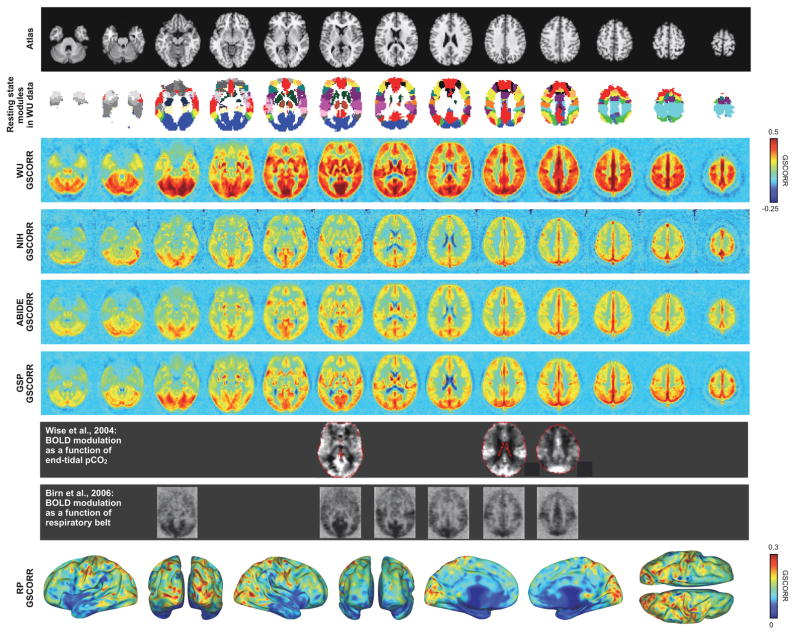
Figure 4. Spatial distribution of global signals in each cohort.
At top, an atlas image and the WU modules reported in [Power, 2011]. At middle, the median GSCORR map across each cohort. In the gray rows, published images are paired to the approximately corresponding slices of GSCORR. At bottom, GSCORR in the RP datasets (6.5 hours of data, see Figure S4). The RP data, from a single individual, are easier to view on a surface because the central tendency of dozens of scans is less spatially blurred than in other cohorts and thus contains complex folding patterns. See Figure S6 for further illustrations of RP and WU data, and surface visualizations of modules in these datasets.

