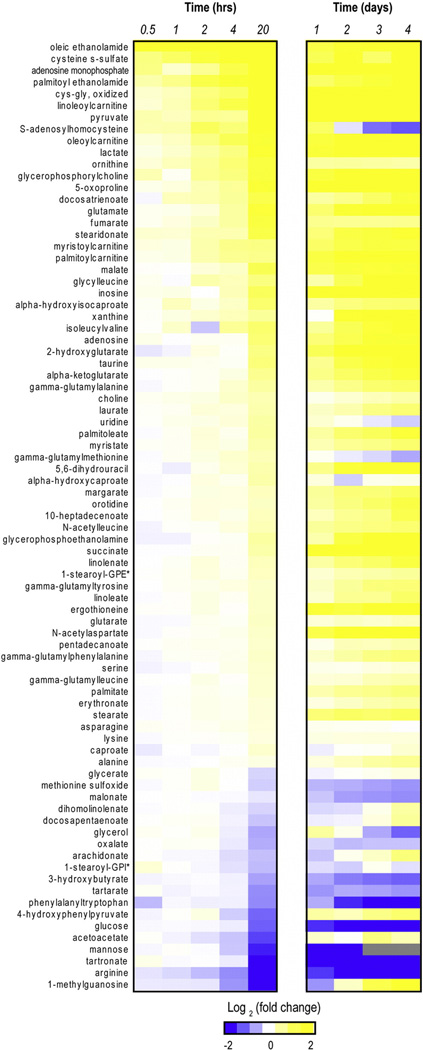
Fig. 1.
Analyte perturbations during processing delays. The heat maps show the average fold change values across two independent assays (0–20 h and 0–4 day studies) for a subset of relevant analytes (i.e., named compounds that underwent a significant fold change (FDR < 0.01) during the 0–20 h time course assay). *GPE = glycero-3-phosphoethanolamine; GPI= glycerophosphoinositol.

