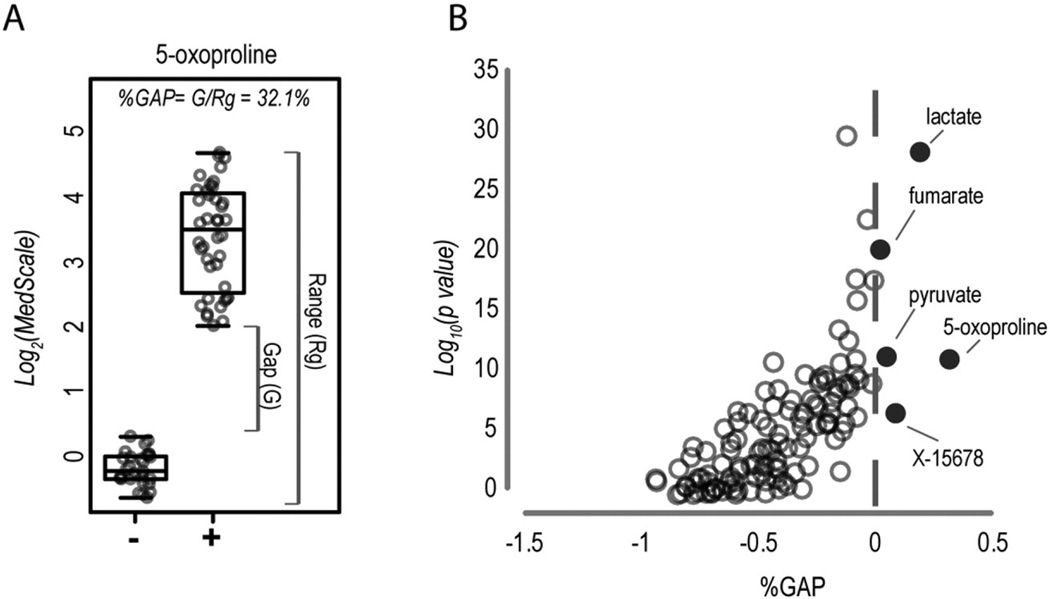
Fig. 2.
Utility of single biomarkers in the detection of processing delays. (A) The %GAP calculation used to determine test-set diagnostic performance is shown for 5-oxoproline. (−) indicates TESTneg and (+) indicates TESTpos samples. (B) The %GAP was calculated for all biomarkers identified in the 0–20 h time course assay. %GAP values are plotted in terms of p-values (heteroscedastic Student's t-test) to illustrate the utility of the %GAP approach as opposed to standard analyses of population mean differences. Dark circles indicate analytes with a positive %GAP value, that were thus capable of 100% diagnostic accuracy in the test set.

