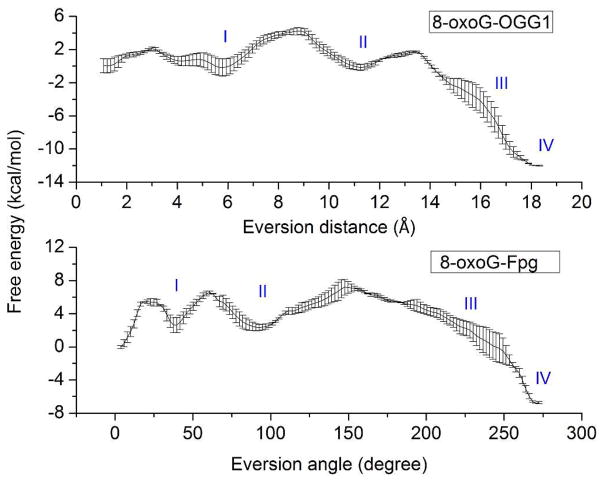
Figure 11.
Free energy profiles for 8-oxoG eversion in OGG1 and Fpg. Four distinct steps of eversion are labeled as I, II, III and IV. Note that the progress variables on the X axes are not the same in the two studies, thus alignment of minima between systems is arbitrary. The error bars reflect differences between two independent runs.

