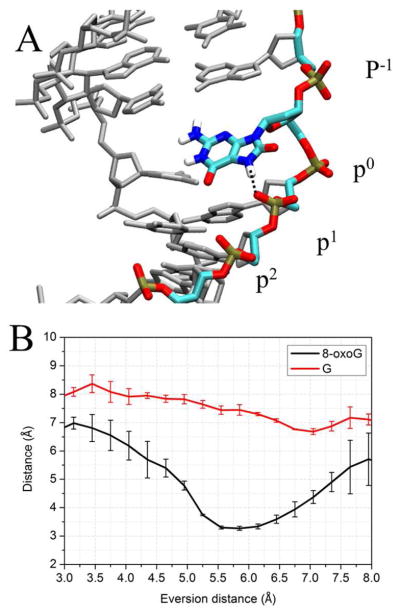
Figure 4.
A, the DNA structure in eversion step I of Figure 3, with an eversion distance of 6.1 Å. The black dots indicate the hydrogen bond between the N7 of 8-oxoG and the OP2 of p1. Hydrogen atoms are present but most are not shown for clarity. B, comparison of change during eversion of average distance between the OP2 of p1 and the N7 of 8-oxoG (black) and G (red). The error bars reflect the difference between two independent runs.

