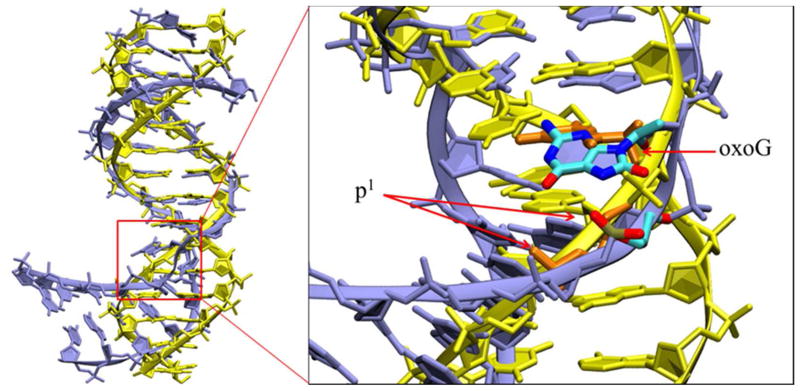
Figure 5.
Superimposition of the bent DNA (purple) from Step I and standard B-DNA duplex (yellow, generated by 3DNA42). Hydrogen atoms are present but most are not shown for clarity. In the magnified region, the B-DNA is in yellow with 8-oxoG and p1 in orange; the DNA from step I is purple with 8-oxoG and p1 colored by atom. The difference in geometries is consistent with the distance data shown in Figure 1B.

