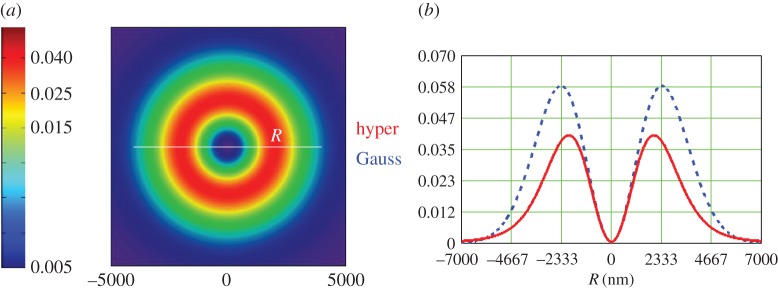
Figure 2.
Intensity |E+|2+|E−|2 (cf. equation (4.4)) at z=0 of the hypergeometric beam of equation (4.3) . (a) Colour map of the transversal distribution. (b) A cut of this spatial distribution as a function of the coordinate R along a diameter (full red).The distribution when the 1F1 functions are replaced by a Gaussian of the same σ is also shown (broken blue line). (Online version in colour.)

