
Figure 2.
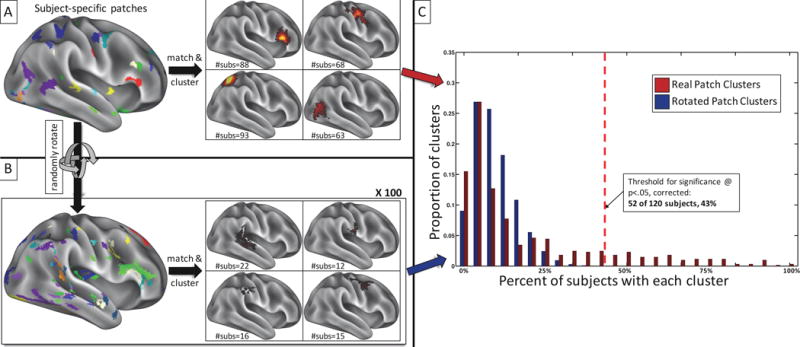
Randomly rotating patch clusters around the cortical surface provides an empirical description of the null expectation for clustering the system patches that are not observed in group-average system maps. A) All system patches that do not match the group-average systems are identified in each subject (see example on the left) and matched across subjects via the distance-based patch-matching procedure. Matched patches are then clustered across subjects (see examples on the right), and the number of subjects who have a patch in each cluster is noted. B) A null expectation of these patch clusters is created by taking the non-group system patches in A) and randomly rotating them around the cortex in each subject, producing patches of the same size and shape but random locations (see example on the left). These randomly rotated patches are then matched across subjects and clustered as in A), and the number of subjects who have a patch in each cluster is noted. This procedure is iterated 100 times. C) The distributions of subject counts for clusters of real (red) and rotated (blue) patches. Many clusters of real patches are entirely outside the distribution of random patch clusters. The red dotted line indicates the threshold set to determine real patch clusters significantly (p<.05, Bonferroni-corrected for multiple comparisons) outside the distribution of random patch clusters.