
Figure 5.
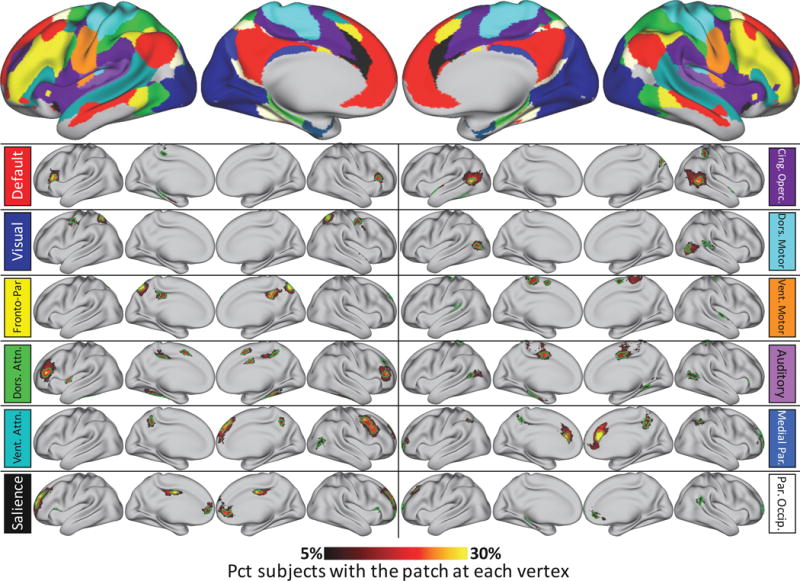
Probabilistic maps and characteristic patches of all system patches identified in at least 52 individuals (corresponding to p<.05, Bonferroni corrected) in the Wash U dataset, but not similar to anything in the group-average systems (top). All probabilistic maps within a system are summed here for display purposes. The green outlines indicate “characteristic patches”, defined as objects with the median surface area of all individual subject versions of each patch that follow the topography of the patch’s probabilistic map. The color block next to each map indicates the brain system of the displayed patches. Note that for the two medial temporal systems, no non-group patches were detected outside of low-SNR regions (inferior temporal and orbitofrontal cortex). Note the change in color map thresholds relative to Figures 1 and 4; this is necessary in order to demonstrate the dynamic range of the spatial distributions.