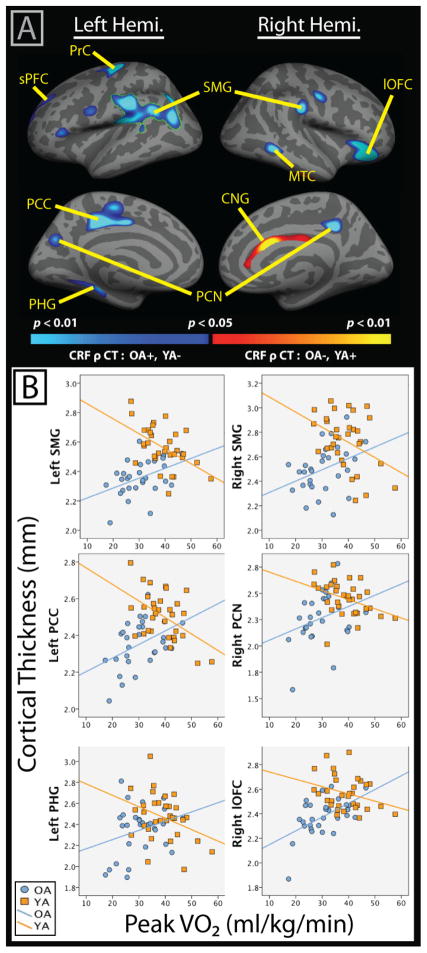
Figure 1.
A) Results of whole-brain vertex-wise analysis evaluating the differential association between peak VO2 (CRF) and cortical thickness (CT) in older (OA) versus young adults (YA), controlling for sex and education. Results that survived a cluster-based correction for multiple comparisons (clusterwise threshold of p<0.05) are outlined in green and include the left SMG. Blue color scale represents interaction effects where peak VO2 and cortical thickness were positively correlated in OA and negatively associated in YA. The opposite pattern was observed in the right CNG, although within-group correlations between CRF and thickness were not significant in follow-up partial correlations. B) Scatterplots visualizing association of cortical thickness and peak VO2 by Age Group. Note: CNG= cingulate; lOFC=lateral orbitofrontal cortex; MTC=middle temporal cortex; PCC= Paracentral/Posterior Cingulate Cortex; PCN=Precuneus; PHG= parahippocampal gyrus; PrC= Precentral Cortex; SMG= supramarginal gyrus; sPFC= Superior Prefrontal Cortex;

