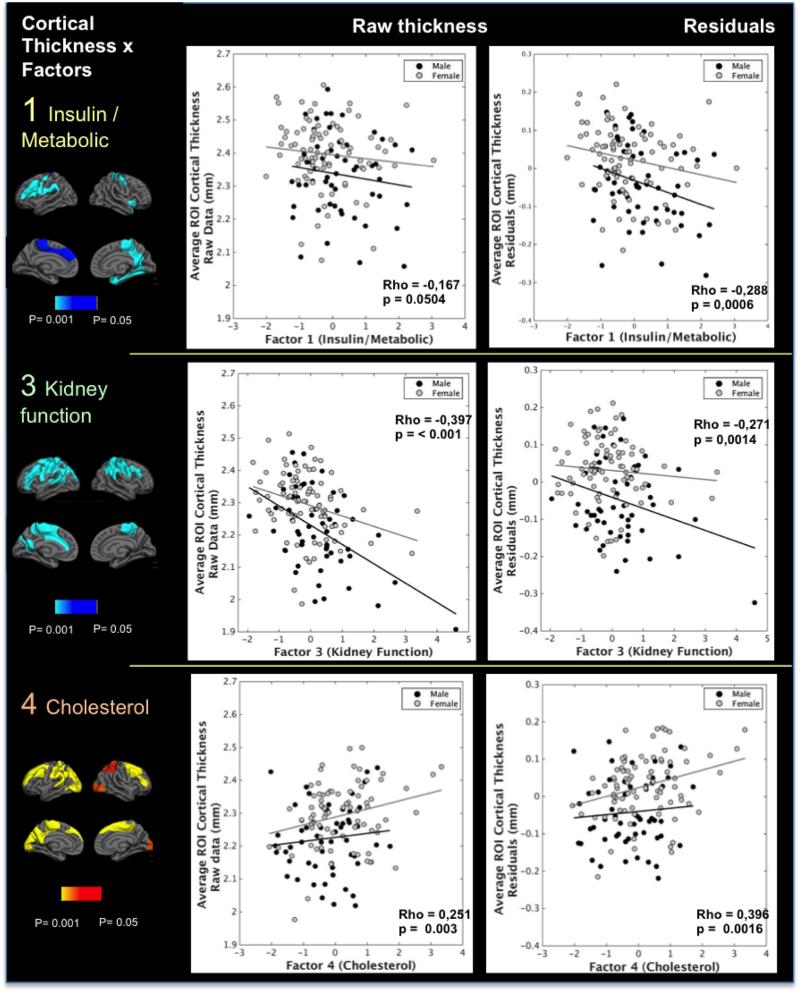
Figure 2.
scatterplots of the associations between factors 1, 3 and 4 and cortical thickness. Raw cortical thickness values (left column) and residuals (right column) of the regressions between thickness and age were extracted from ROIs defined by the significant voxel-wise associations with each of the factors after multiple comparisons. These values were used for examination of the distribution of the effects. Male: black spheres and lines; Female: gray spheres and lines. Associations for factor 1 were significant only after accounting for age as a covariate; other factors were significant in all sub analyses. The differences noted in the effects related to sex are not statistically significant. These effects, however, are always in the same direction in both genders.

