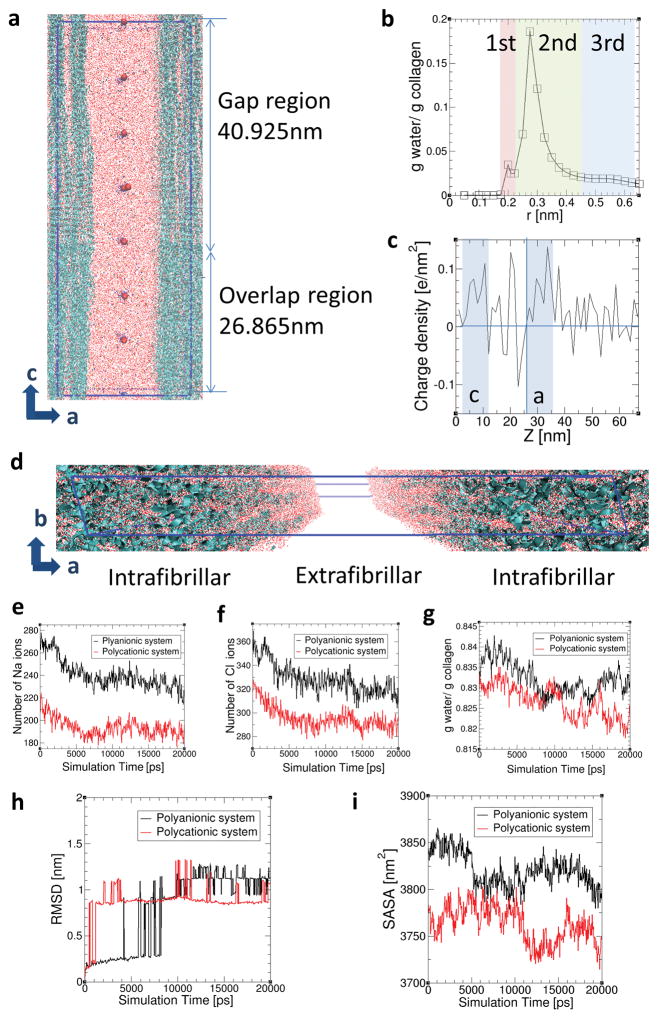
Figure 5.
Molecular dynamics simulations. a) Side view of simulated collagen fibrils with intrafibrillar and extrafibrillar spaces in polycationic solution. Blue ribbons and large red dots represent the collagen triple helices and bulky polycations, respectively. Small red dots, yellow dots and blue dots are water molecules, Na ions and Cl ions, respectively. The simulation box is indicated as the blue line. b) Intrafibrillar hydration layers surrounding collagen structures within the intrafibrillar regions. Distance r is the minimum distance between the water molecules and the collagen atoms. The 1st, 2nd and 3rd hydration layers were specified as (0–0.21 nm), (0.21–0.425 nm) and (0.425–0.625 nm) from the surface of the collagen triple helices based on curvature and inflection points. The collagen structure together with these three hydration regions surrounding each collagen helix are considered as intrafibrillar regions. c) Charge density along the c axis of the collagen structures. d) Collagen structures with water molecules in the intrafibrillar regions and extrafibrillar region. Variations in the distribution of e) Na ions, f) Cl ions and g) water molecules in the intrafibrillar region (r < 0.625 nm) are shown as a function of simulation time in the polyanionic (black) and polycationic (red) systems, each of which has negatively- and positively-charged bulk particles in the extrafibrillar region. Variations in h) RMSD of collagen molecules and i) SASA of collagen structures over simulation time in the polyanionic (black) and polycationic (red) systems.

