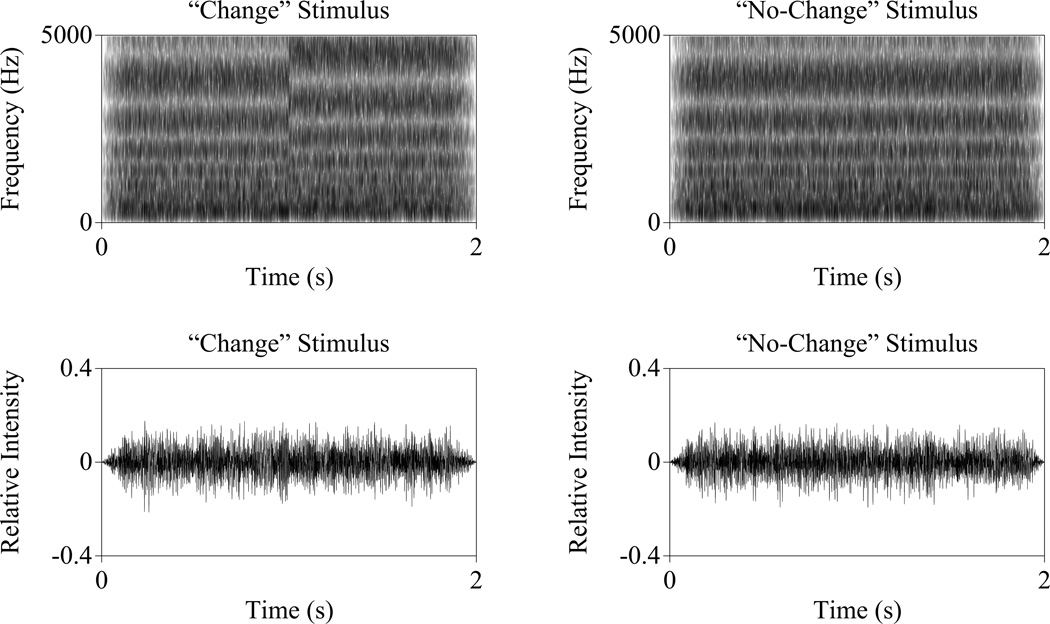
Figure 2.
Example acoustic spectrograms (top) and time waveforms (bottom) for “change” (left) and “no change” (right) stimuli. Both stimuli have identical ripple densities (2 ripples per octave) and depths (20 dB peak/trough depth). The spectral envelope change occurred at 1s in the change stimulus.

