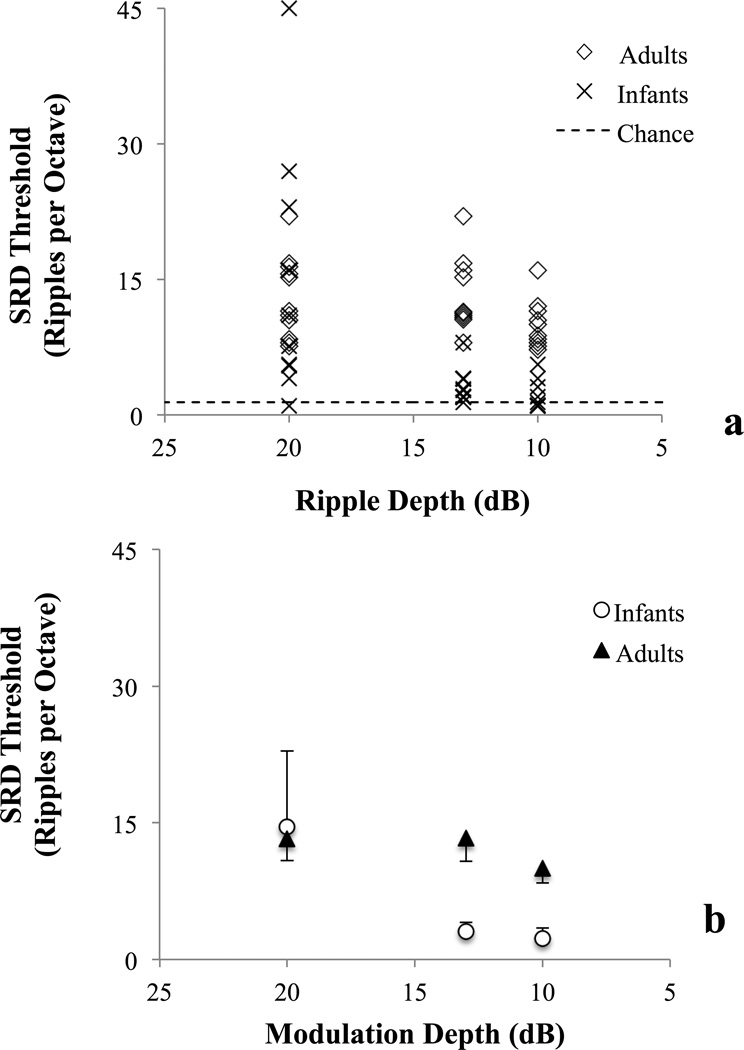
Figure 4.
Individual spectral ripple discrimination (SRD) thresholds stratified by age group and ripple depth (4a). Each marker indicates performance of an individual listener with up to 5% jitter to highlight overlapping values. Thresholds above dotted line are above chance performance based on 1000 simulated sessions. Mean spectral ripple discrimination (SRD) threshold as function of ripple depth and age group (4b). Up error bars and down error bars indicate 95% CI for infants and adults respectively.

