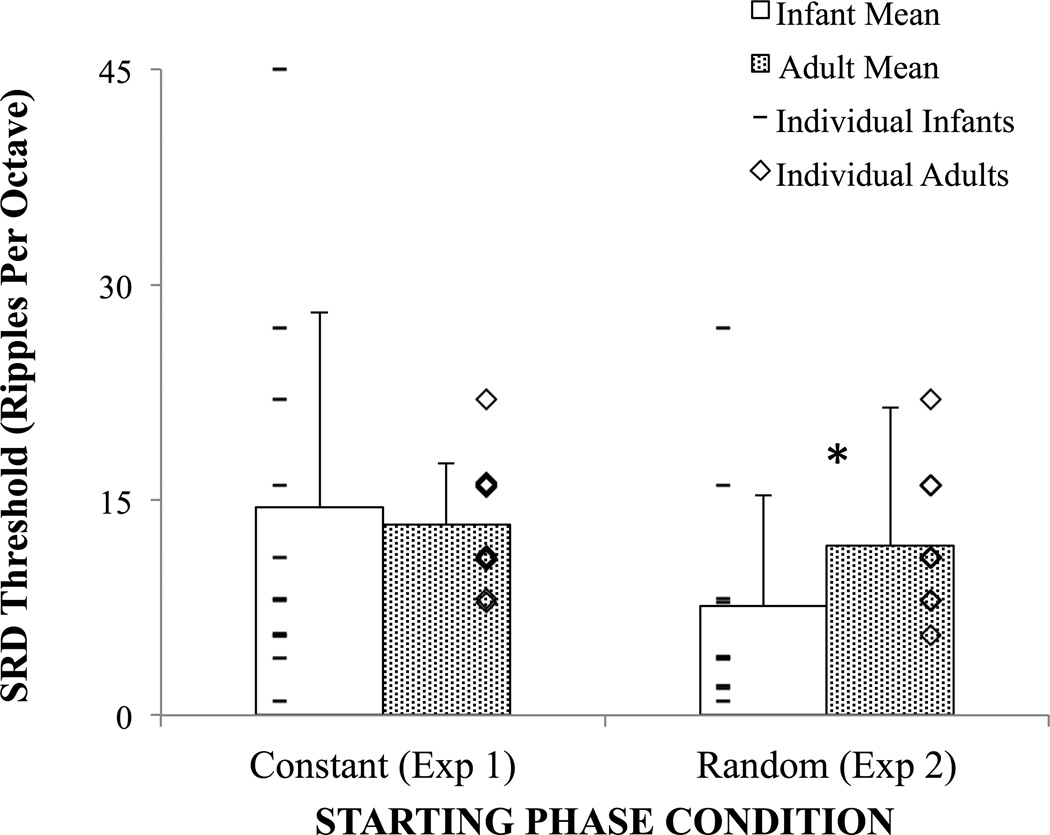
Figure 5.
Mean spectral ripple discrimination (SRD) threshold as a function of age group with random versus constant spectral envelope starting phase. Error bars indicate 1 standard deviation from the mean. Individual thresholds are shown with up to 5% jitter to highlight overlapping values. * Indicates significant effect of age, Independent Samples t-test, 2-tailed p = 0.049.

