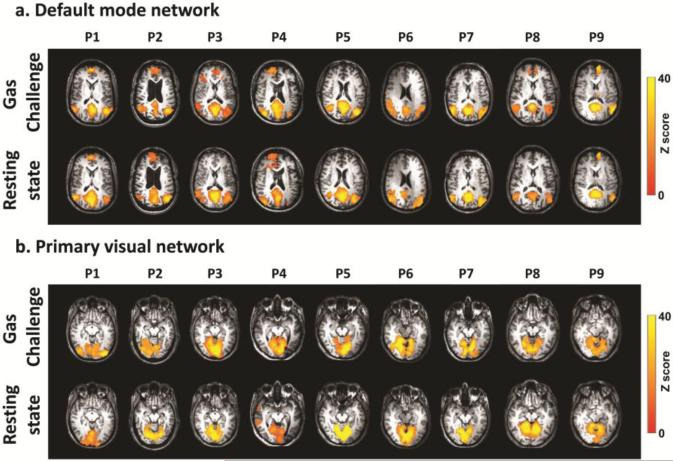
Figure 6.
Examples of the functional connectivity networks obtained from individual ICA analysis in Moyamoya patients (N=9). (a) Maps of the default mode networks. (b) Maps of the primary visual networks. Top rows show the results from conventional resting-state fMRI scan without gas inhalation. Bottom rows show the results from the fMRI scan with concomitant CO2 and O2 challenge.

