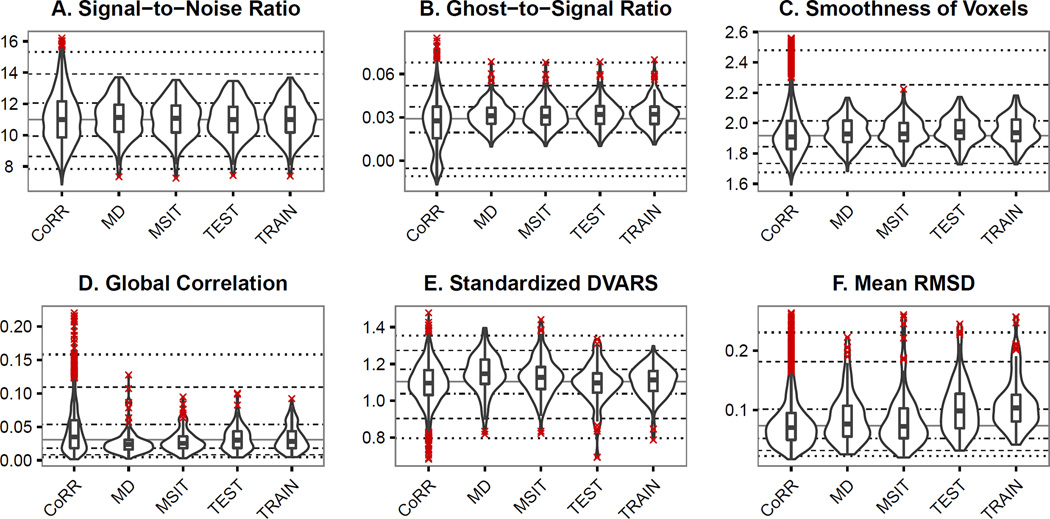
Figure 6.
Illustrations of the overall quality of the functional neuroimaging data. Distributions of the measures for fMRI data from the MSIT, Moral Dilemma, Resting Scan (NFB Train), and Neurofeedback (NFB Test) are shown in comparison to resting state fMRI data from the CoRR dataset. Quality measures are represented as violin plots overlaid with boxplots (center line represents the median, box range represents the confidence interval, X data points indicate outliers (1.5× Interquartile range)). Lines representing the 5th, 10th, 25th, 50th, 75th, 90th, and 95th percentiles for the CoRR data are shown to simplify visual comparisons. Standardized DVARS is mean root-mean-square variance of the temporal derivative of voxels time courses that has been standardized to make the values comparable across different acquisition protocols. Mean RMSD is the mean root mean squared deviation (RMSD) of motion between consecutive volumes.

