
Figure 5.
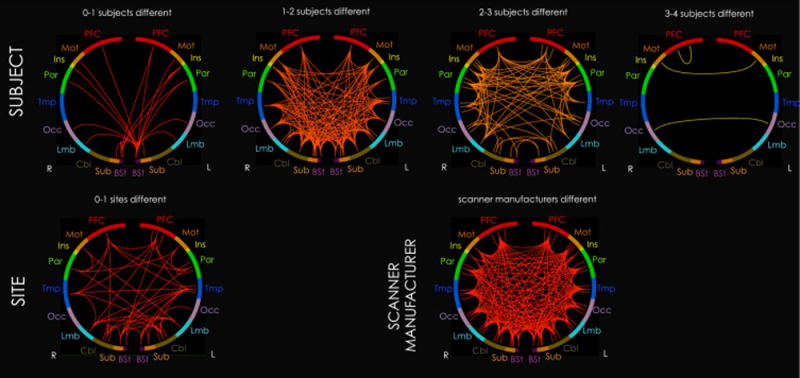
Summary map of inter-lobe edges showing significant effects (p<0.05, FDR-corrected) on matrix connectivity for each individual site, subject, and scanner manufacturer regressor. No day effects were found. Only one case is shown for scanner manufacturer because GLM estimates are identical for each regressor when there are only two regressors. These maps correspond with Figures 1 and 3, but are summarized for visualization purposes. 278 regions are organized into 10 roughly anterior-to-posterior lobes: prefrontal cortex (PFC), motor cortex (Mot), insula (Ins), parietal cortex (Par), temporal cortex (Tmp), occipital cortex (Occ), limbic system (Lmb), cerebellum (Cbl), subcortex (Sub), and brainstem (Bst). A single inter-lobe edge in the summary map represents the mean number of affected cases for all edges between the two lobes. For example, the inter-lobe edge between right and left motor cortex under the “3–4 subjects different” heading indicates that, on average, edges between right and left motor cortex are unique to 3–4 subjects. Brighter (more yellow) colors also represent inter-lobe edges affected by multiple cases.