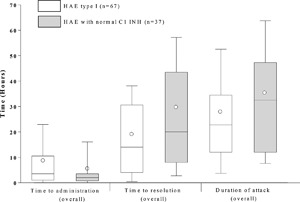
Figure 3.

Treatment outcomes using icatibant. Time to administration, resolution, and attack duration (Overall). Box = IQR, whiskers = standard deviation, horizontal line = median, open circle = mean; Time to events were calculated only for attacks with complete data for time to administration, time to resolution, and attack duration. Note that no data on attack duration, time to administration, and time to resolution for HAE type II patients were recorded in the database.
