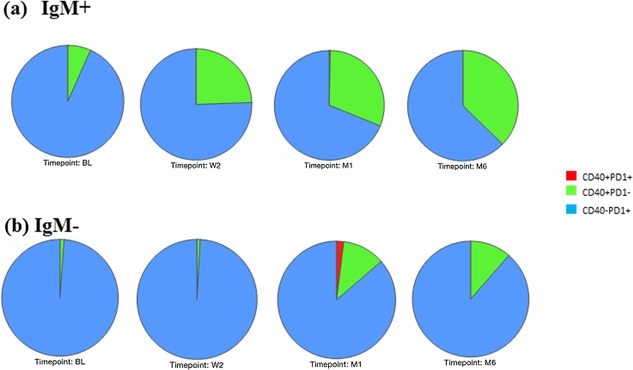
Figure 4.

Frequencies of Regulatory B‐cells during treatment. Pie charts depict frequencies of B‐cells expressing either CD40, PD1, or both simultaneously in TB participants during treatment. Where BL is diagnosis, W2 is week 2, M1 is month 1, and M6 is month 6 of treatment. (a) Frequencies of IgM positive B‐cells and (b) Frequencies of IgM negative B‐cells. TB cases n = 13.
