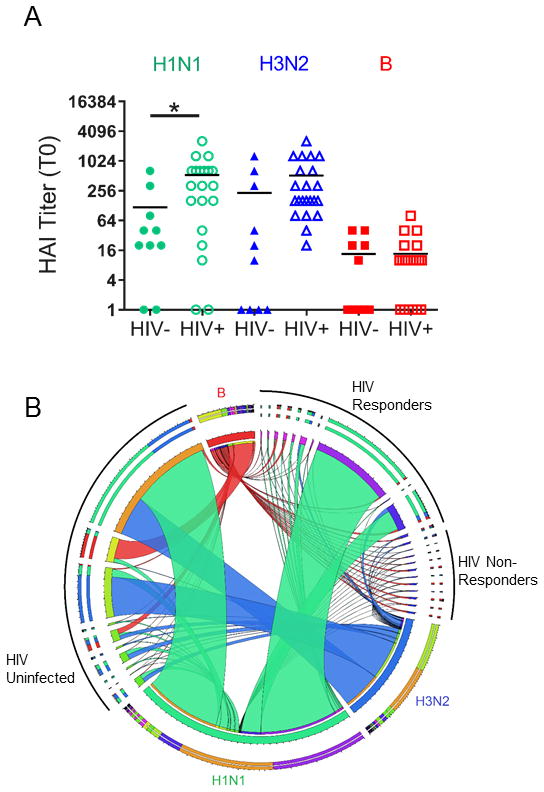
Figure 1. Serological Response to Influenza Vaccine Strains.

A) Baseline serum titers from HIV-infected (n=22) and –uninfected (n=10) individuals for each of the influenza strains contained in the 2012–2013 vaccine as determined by HAI Assay. Each symbol represents one person and horizontal lines show mean of the data. Statistical significance was determined by student’s T test, *denotes p-value<0.05. B) Circos plot (49) showing fold change in serum titer as determined by HAI assay for each participant and influenza strain. Ribbons originate from a node representing each participant and connect to individual vaccine strains (Green, H1N1; Blue, H3N2; Red, B). Ribbon thickness represents the fold increase from T0 to T1. Study participants were clustered into 3 groups: HIV Uninfected, HIV responders and HIV non-responders indicated by black arcs outside the circus plot.
