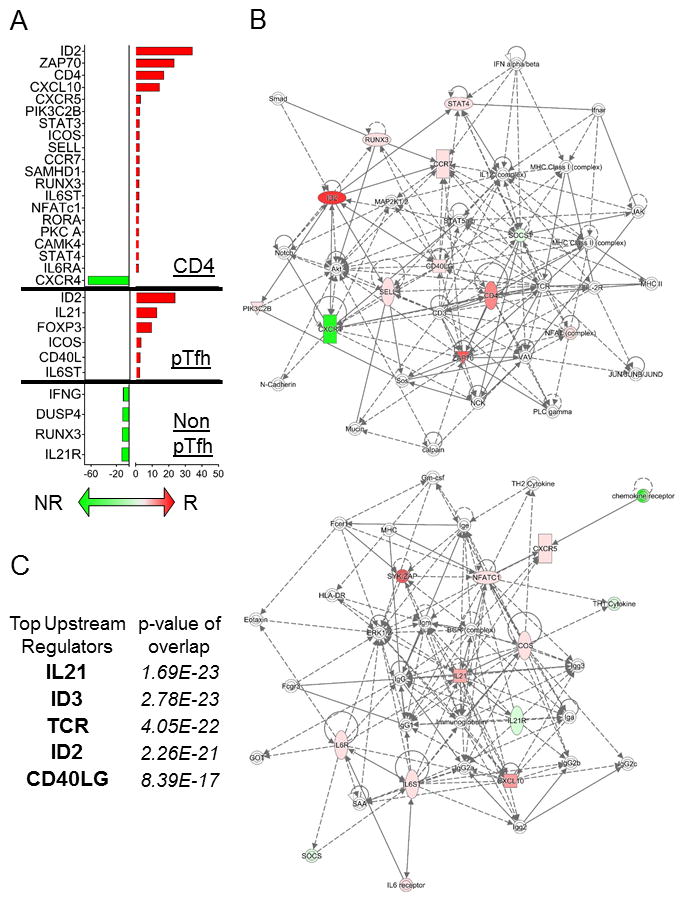
Figure 5. Differential gene expression analysis in H1N1-Stimulated Pre-Vaccination CD4, pTfh and Non-pTfh cells between HIV+ Flu vaccine responders and Non-responders.

A) Bar graph showing the average fold change in gene expression between R and NR for CD4 T cells (top), pTfh (middle), and non-pTfh (bottom) using ANOVA p-value <0.05 and fold change >1.5 as cutoffs. Red bars correspond to gene expression that was higher in R compared to NR and Green bars indicate higher gene expression in NR compared to R. B) Gene networks were generated using Ingenuity Pathway Analysis (IPA) software and combined DEGs from the 3 cell types in (A) as input. Colors in the network are defined as follows: red indicates up-regulation in R vs NR, green indicates up-regulation in NR vs R, and white indicates the molecule was added from the Ingenuity Knowledge Base. Solid lines indicate direct interaction and dashed lines indicate indirect interaction. C) The top 5 upstream regulators were determined using IPA software and combined DEGs from the 3 cell types in (A) as input. The overlap p-values show statistically significant overlap by Fisher’s exact test between dataset genes and the genes that are known to be regulated by a particular molecule.
