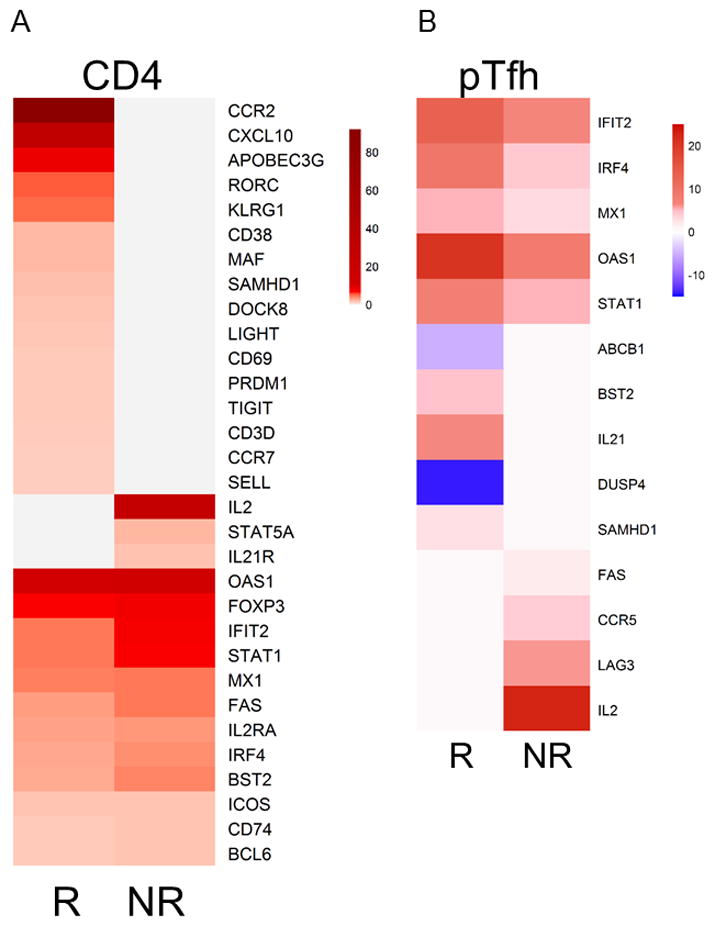
Figure 6. Gene induction in response to H1N1-stimulation in Pre-vaccination CD4 and pTfh cells in HIV+ responders and Non-responders to Influenza Vaccine.

Dual column heatmaps show average fold change in gene expression from H1N1-stimulated cells compared to unstimulated cells in A) CD4 T cells and B) pTfh cells. Values were derived by calculating the delta for each study participant such that (Et_H1N1) − (Et_Unstim) =Delta, if the group of Deltas was found to be significant (p-value<0.05) for the group (R or NR) then the average fold change was calculated and displayed in the heatmap as a color based on the scale provided to the right of each heatmap.
