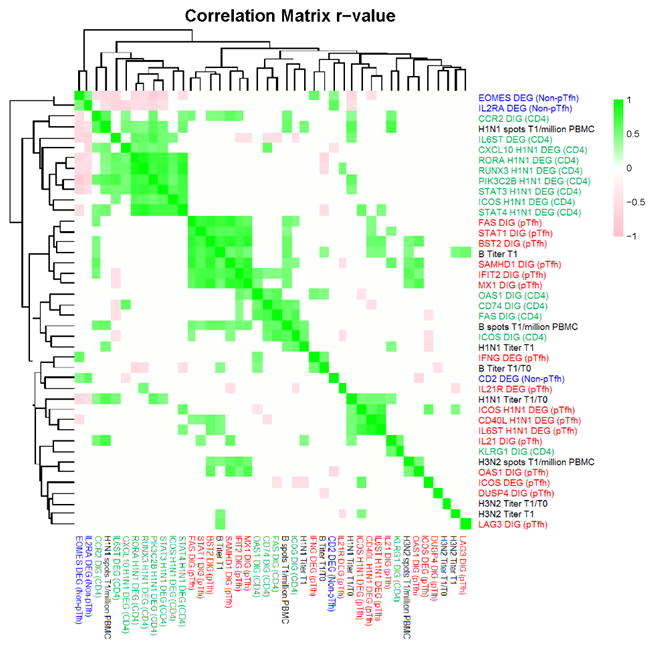
Figure 7. Cluster analysis of DEGs and DIGs with serological and immunological correlates of TIV response.

Heatmap showing pairwise Spearman correlations for a group of parameters including 33 DEGs and DIGs and 9 serological and immunological correlates were calculated against each other using R statistical software. Spearman correlations that resulted in p-value >0.05 were assigned an r-value of 0 (white), while significant correlations were clustered and visualized as a heatmap depicting r-values on a scale of −1 (pink) to 1 (green). The parameters tested are color-coded as follows: blue font designates parameters from Non-pTfh cells, green from CD4 T cells, red from pTfh cells, and black font designates Serum Titer and Elispot results for each vaccine antigen.
