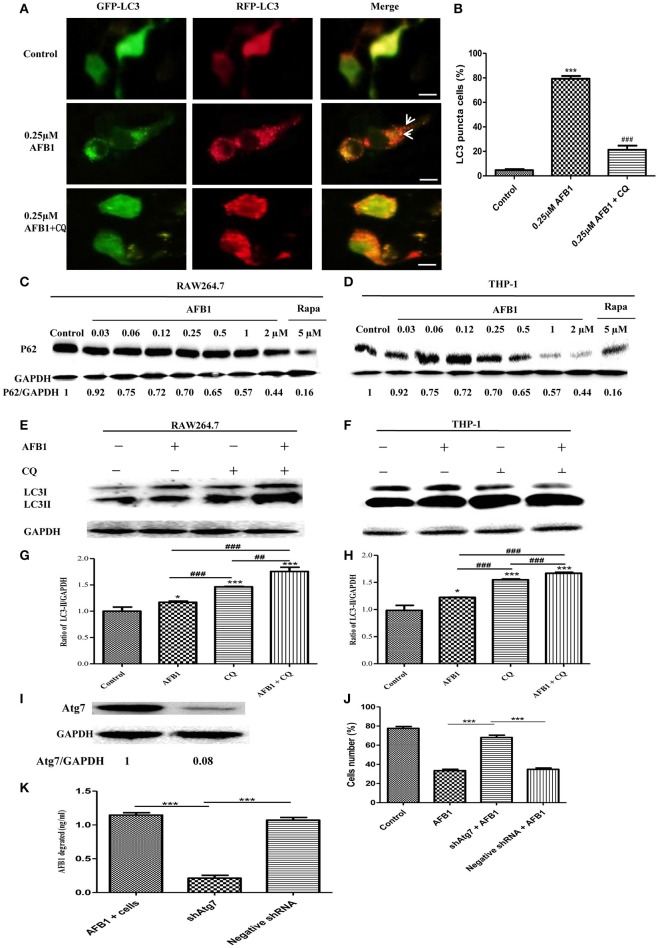
Figure 2.
AFB1 induced a complete autophagic process. (A) RAW264.7 cells were transfected with tandem GFP-RFP-LC3 plasmid for 12 h. Cells were pretreated with or without CQ, followed by treatment with AFB1 (0.25 μM) for 2 h and observation by fluorescence microscopy. Scale bars = 20 μm. (B) The percentage of GFP-RFP-LC3 puncta cells was calculated. ***P < 0.001 compared with the control groups; ###P < 0.001 compared with AFB1. (C,D) RAW264.7 cells and THP-1 cells were incubated in 6-well flat-bottom plates (1 × 10⁶ cells/well) and cultured in serum-free and antibiotic-free medium for 12 h. Following treatment with Rapa (5 μM, 12 h), the cells were treated with different concentrations of AFB1 from 0.03 to 2 μM for 1.5 h. Western blotting of SQSTM1 was performed. (E,F) RAW264.7 cells and THP-1 cells were pretreated with CQ (20 μM) for 1 h and subsequently exposed to AFB1 (0.25 μM) for 1.5 h. Western blotting for LC3 was then performed. (G,H) The ratios of p62/GAPDH and LC3-II/GAPDH were calculated. *P < 0.05, ***P < 0.001 compared with the control groups of the same cell line; ##P < 0.01, ###P < 0.001. (I) Western blotting of Atg7 in RAW264.7 cells with or without knockdown treatment. (J) Cell viability was estimated using the Cell Counting Kit-8 (CCK-8) assay ***P < 0.001. (K) Non-transfected RAW264.7 cells, Atg7-silenced cells, and cells transfected with the shRNA negative control cells were incubated in 24-well plates (2 × 10⁵ cells/well) with serum-free medium for 12 h, followed by treatment with AFB1 (2 μM) for 8 h. We performed AFB1 ELISA to determine the AFB1 content using an ELISA kit. ***P < 0.001. The data are representative of three experiments with similar results.

