Figure 5.
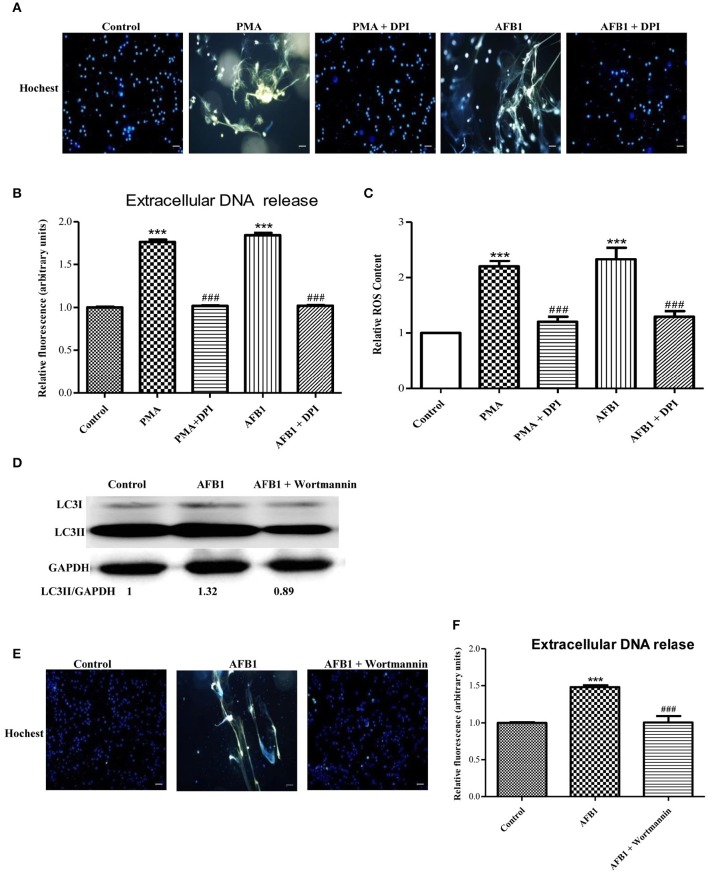
Autophagy and ROS are required for AFB1-induced MET formation. (A) THP-1 cells were pre-treated with the NOX2 inhibitor DPI (50 μM) for 1 h then, PMA (16 nM) and AFB1 (0.25 μM) were added to the cells for 2 h. The cells were stained with Hoechst 33342 (1 μM) and then observed by fluorescence microscopy with a 20 × objective lens. Scale bars = 50 μm. (B) The fluorescence intensity of extracellular DNA was detected by a plate reader. (C) For the quantification of cytosolic ROS, THP-1 cells were incubated in 24-well plates (2 × 10⁵ cells/well), pre-treated with DPI (50 μM) for 1 h and then treated with PMA (16 nM) and AFB1 (0.25 μM). Cytosolic ROS were labeled by DHR 123 (1 μM) and detected by a plate reader. The data were analyzed by Graphpad prism software (GraphPad, San Diego). ***P < 0.001 compared with the control groups in the same cell line; ###P < 0.001 compared with the PMA and AFB1. The data are representative of three experiments with similar results. (D) THP-1 cells were cultured in serum-free and antibiotic-free medium for 12 h. Then, cells were pretreated with wortmannin (100 nM) for 1 h followed by AFB1 (0.25 μM) for 1.5 h. Western blotting of LC3 was performed. (E) THP-1 cells were pre-treated with the autophagy inhibitor wortmannin (100 nM) for 1 h, and then AFB1 (0.25 μM) was added to the cells for 2 h. The cells were stained with Hoechst 33342 (1 μM) and then observed by fluorescence microscopy with a 20 × objective lens. Scale bars = 50 μm. (F) The fluorescence intensity of extracellular DNA was detected by a plate reader ***P < 0.001 compared with the control groups; ###P < 0.001 compared with the AFB1.

