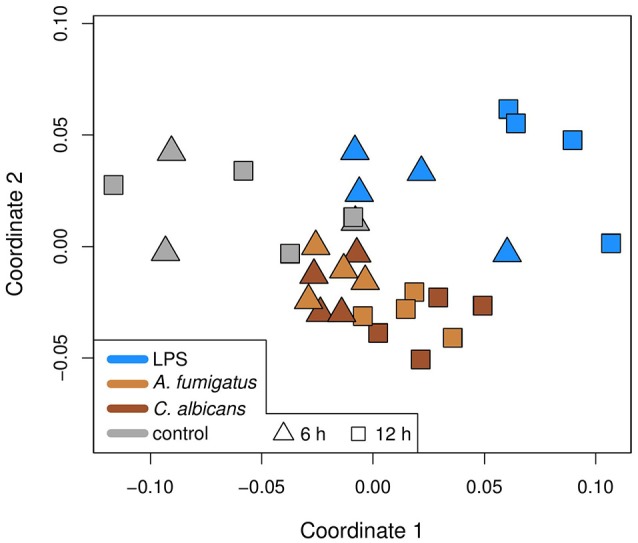
Figure 2.

Multidimensional scaling (MDS) plot of the samples in this study. The MDS is based on Spearman correlations, which means that similar samples are close to each other, while different samples are distant. Colors represent the treatment of a sample and the shapes the time point. Infection is different to control and bacterial infection is different to fungal.
