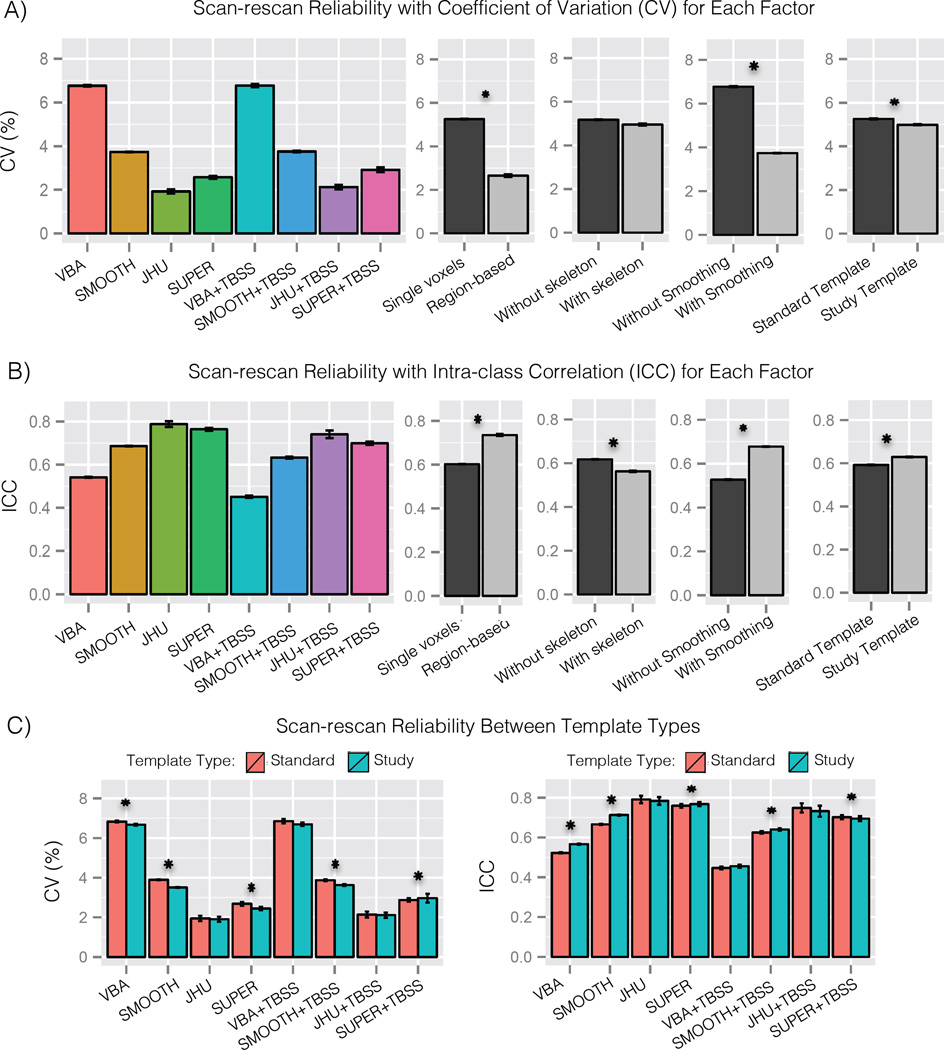
Figure 2.
Results from the scan-rescan experiment in Sec. 3.1 showing reliability across methods and between the major factors among the methods. Panel A shows the coefficient of variation (CV), which indicates the percentage of variation across scans of the same subject (smaller is better). Panel B shows the intraclass correlation, which indicates what proportion of variance is between subjects (larger is better). Panel C shows the relative performance of study-specific and standard templates in each of the tested methods. The results show high variation across methods. Among the major factors, smoothing and region-based analysis had large effects related to reproducibility, while template type and skeletonization had smaller effects. Statistically significant differences (p ≤ 0.05) are marked with an asterisk.

