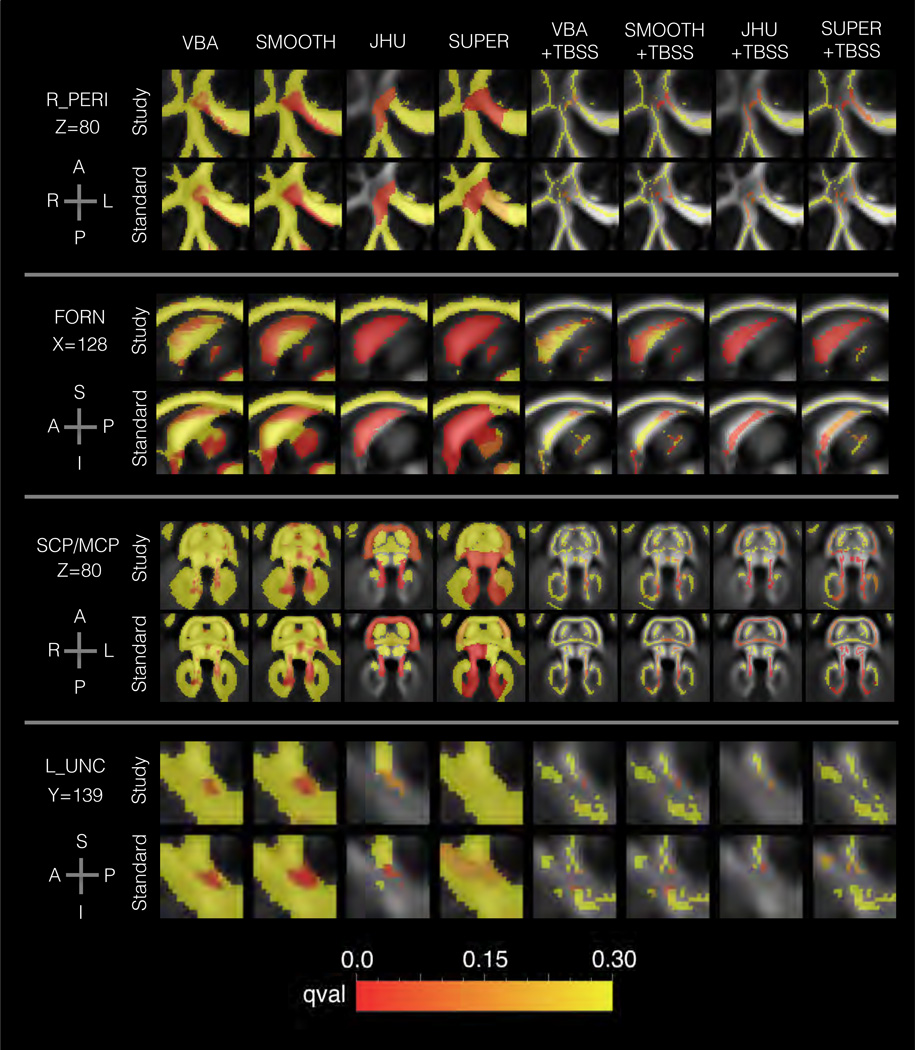
Figure 5.
Results from the aging analysis in Sec. 3.2 showing the spatial patterns of age-related change in FA for each method. The background shows the template FA map, and the foreground shows the FDR q-value. Four areas are shown: right anterior pericallosal white matter (R_PERI), the fornix (FORN), the superior and middle cerebellar penduncles (SCP/MCP), and left uncinate fasciculus (L_NC). The plots are colored to show FDR q-value, with redness indicating greater significance. Note that there is transparency to show the FA map, which may slightly change the perceived q-value. The results show general agreement among methods, although several differences can be noted. VBA, SMOOTH, and SUPER analysis of R_PERI showed a greater extent of significant voxels than other methods. The fornix showed distinct spatial patterns for each template type, namely a greater concentration of significant results in the anterior and posterior portions in the standard template conditions.

