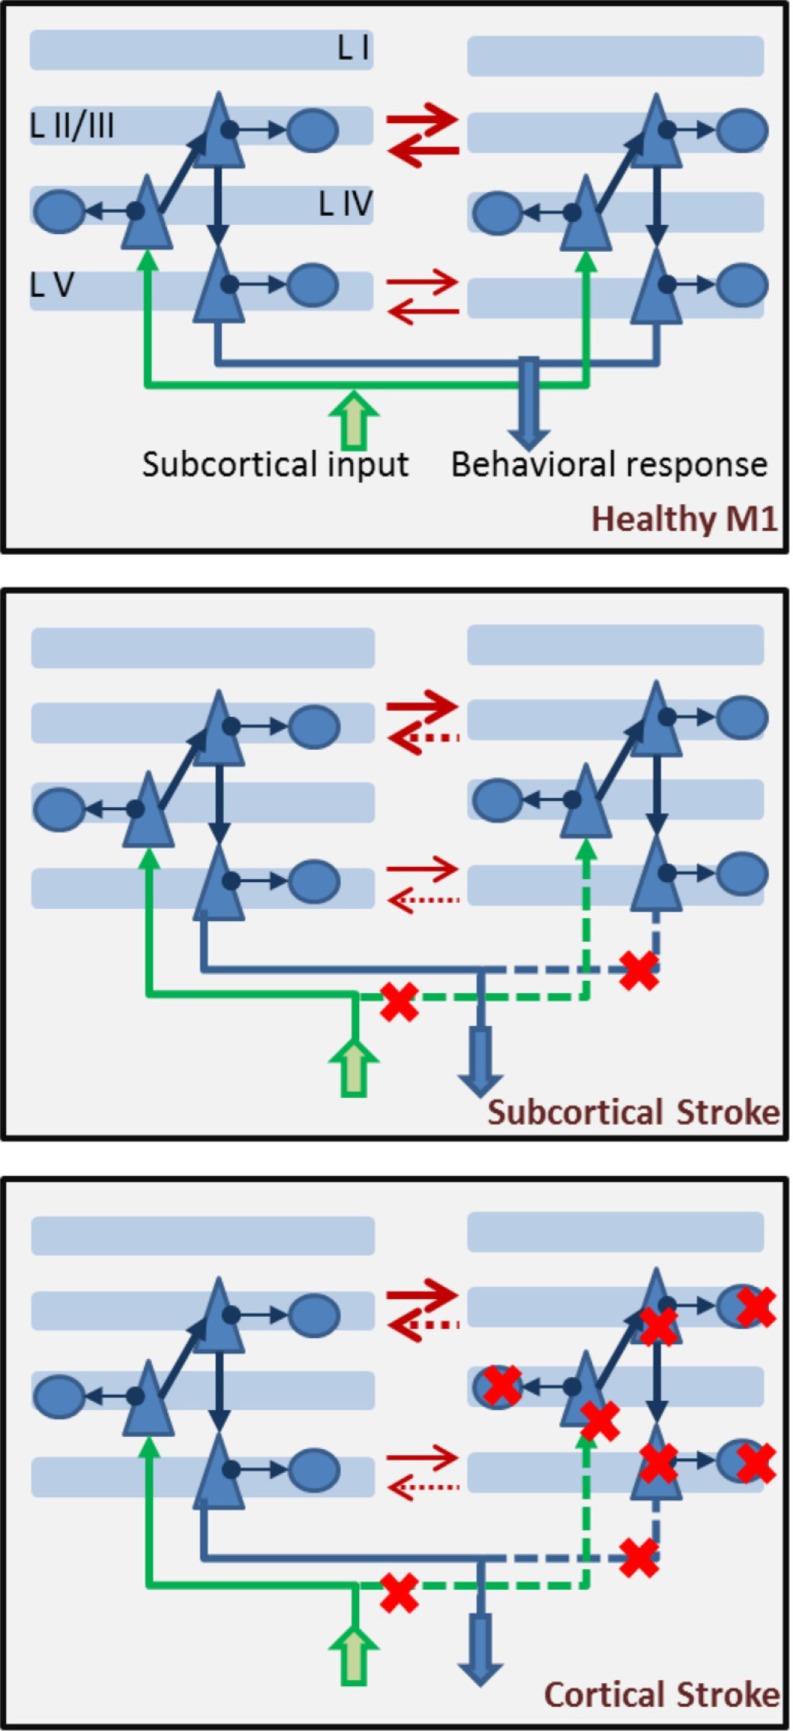
Figure 6.

Components of a biophysical model of stroke dynamics. In the top panel, we show two hemispheres with multiple layers. Each layer, apart from layer I, is populated by pyramidal cells and basket cells, with connectivity as shown in Figure 5. Across layers, projections respect the canonical model of cortical connectivity: layer IV pyramidal cells receive input from subcortical regions (in green), they project to layer II/III pyramidal cells which in turn send their axons to layer V pyramidal cells where the cortical output is prepared and then projected toward other structures (in blue). The two hemispheres inhibit each other (red arrows) at both the layer II/III and layer V level (less strongly). In the middle panel, a subcortical stroke induces cell deaths among subcortical structures, leading to interrupted or strongly reduces input coming into the affected hemisphere (right side) and output being delivered to target regions. Red crosses mark the steps at which the flow of information is interrupted. Note that interhemispheric inhibition comes more strongly onto the affected hemisphere, which is suppressed by both augmented inhibition from a dis-inhibited unaffected hemisphere and reduced incoming subcortical input. In the lower panel, dynamics of the brain after a cortical stroke includes cell death (both excitatory and inhibitory) in the affected hemisphere. Red crosses mark the cells that could be removed. Severity of the damage will be represented by the percent of cells removed from the network. Note that interhemispheric inhibition is imbalanced in this case, as well as the subcortical case.
