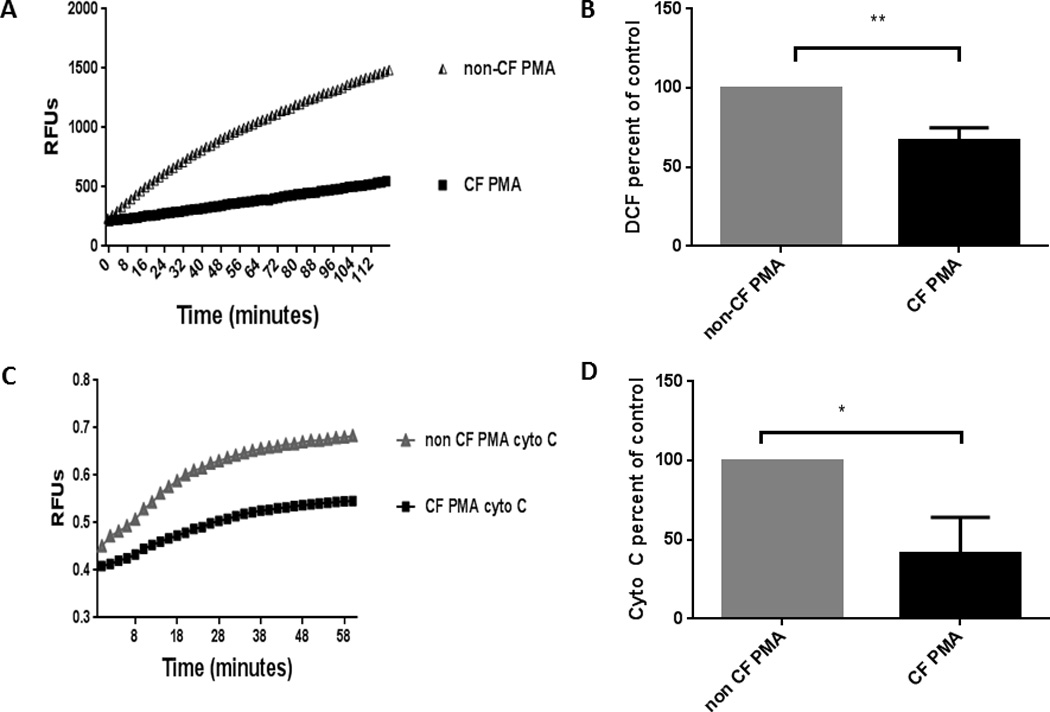
Figure 1. CF MDMs have reduced ROS production in response to PMA.

A) CF and non-CF MDMs were treated with PMA for 30 min and assessed for ROS production using RFUs via a DCF assay. Representative assay of n=6. B) Summed end-point analysis of 1A experiments expressed as %ROS production at 2 h for CF MDMs relative to control non-CF MDMs in response to PMA, P value = 0.002. C) Cells were treated with PMA and/or medium only control in triplicate wells in the presence of 500 U/ml catalase and 80 µM CytC. CytC reduction, indicative of superoxide production, was measured after 60 min of stimulation by subtracting the absorbance at 550 nm of control wells treated with 300 U/ml SOD from test well values. Unstimulated cell background values were subtracted from test conditions, and all values were set relative to the positive control. Representative experiment of n=3. D) Summed end-point analysis of 1C experiments, results are expressed as percentage of non-CF PMA-stimulated cells for three independent experiments, P value = 0.01.
