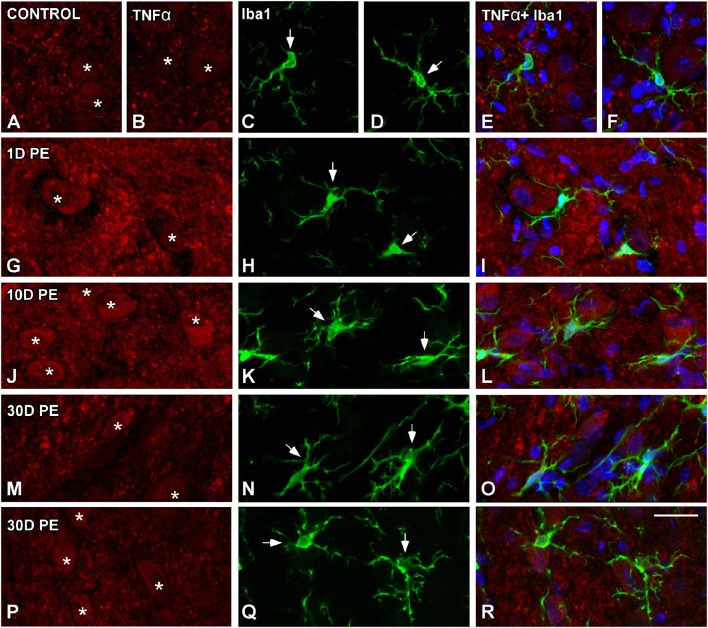
Figure 12.
Confocal images depicting the lack of colocalization between TNF-α and Iba1 in control (A–F) and noise-exposed (G–R) AVCN. Note that TNF-α (red) was only expressed by auditory neurons (asterisks) and not by activated microglia (green) at all time points post-exposure (n = 5 for each group). Asterisks indicate TNF-α-containing neurons while arrows point to microglia. Scale bar: 25 μm in (R).

