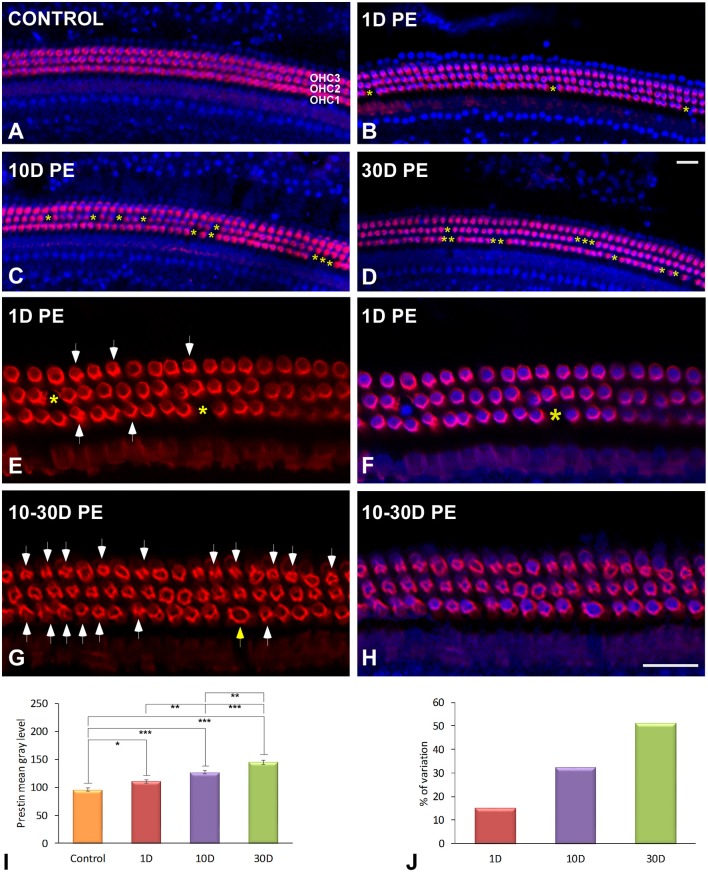
Figure 2.
Surface preparation images illustrating double-labeling of prestin (red) and DAPI (blue) in the middle cochlear turn in control (A) and noise-exposed (B–H) rats. The survival of OHC was significantly decreased with longer time points post-exposure. Loss of OHC are indicated by yellow asterisks. Arrows in (E,G) indicate disrupted OHC stained with prestin protein. The yellow arrow in (G) indicates a swollen nucleus. Quantification of the mean gray levels indicated noise-induced increases in prestin staining when compared to control cochleae (I). The percentage of variation of the immunostaining in noise-exposed (n = 5 for each group) animals relative to control (n = 5) is shown in (J). The time of sacrifice following exposure (PE) is indicated in the upper left of each image. Significant differences in prestin immunostaining among animal groups (I) are indicated by asterisks (*p < 0.05; **p < 0.01, ***p < 0.001). Scale bars: 20 μm in (D,H).

