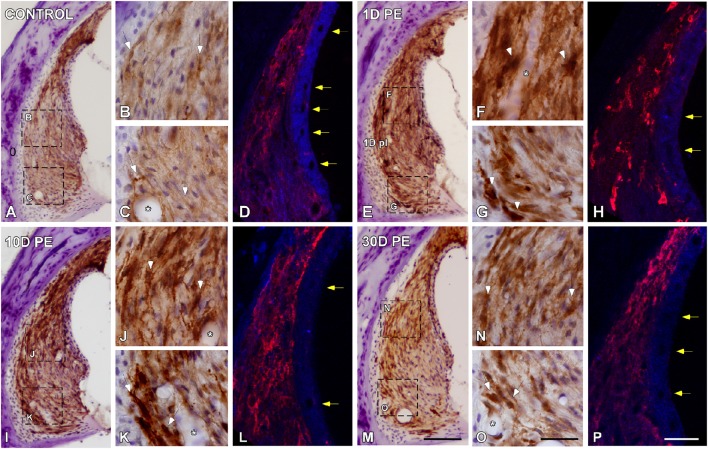
Figure 4.
Digital images showing Iba1-immunostaining in the spiral ligament of control (n = 5) and noise-exposed (n = 5 for each group) rats. When compared to the control condition (A–C), Iba1-immunostaining at all time points post-exposure evaluated was markedly increase in MLC located in type I and IV fibrocytes regions (white arrows in E–G,I–K,M–O). Particularly on day 1, cells were darkly stained and had expanded cell bodies and thickened processes (arrows in F,G). Asterisks indicate the association of MLC with blood vessels. Yellow arrows in (H,L) point to noise-decreases in blood vessels diameter at 1 and 10D after the exposure in comparison to 30D post-exposure (arrows in P) and control (arrows in D) rats. Scale bars: 100 μm in M; 20 μm in O; and 25 μm in (P).

