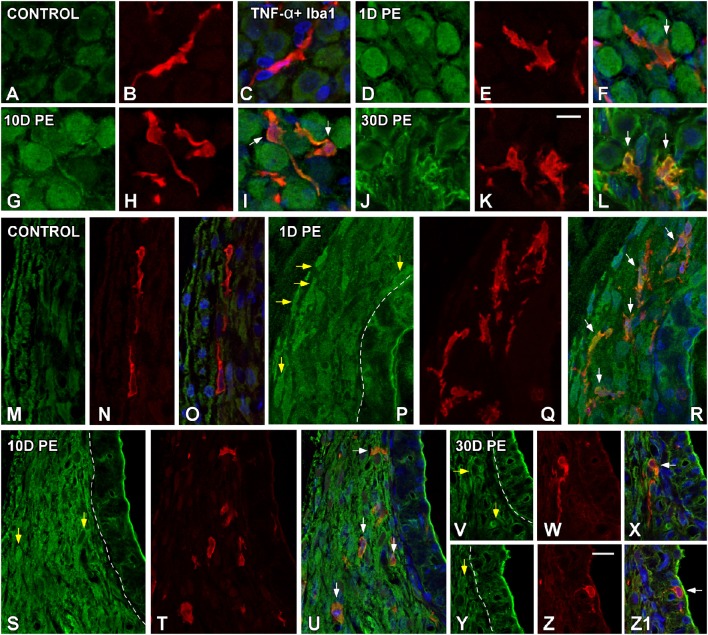
Figure 6.
Confocal images depicting the colocalization between TNF-α (green) and the microglial marker, Iba1 (red), in the SG (A–L), and SL (M–Z1) in control (n = 5) and noise-exposed (n = 5 for each group) rats. In the SG, TNF-α producing cells in response to noise-exposure were neurons (D,G,J) and MLC (E,H,K) while in the SL, TNF-α protein was synthesized by MLC (Q,T,W,Z) and fibrocytes (yellow arrows in P,S,V,Y). White arrows point to double-stained cells in the SG and SL. Scale bars: 10 μm in (K,Z).

