
Figure 4. Yap knockout blocks accumulation of MDSCs in the spleen and pancreata of Kras:Trp53 mutant mice following acute pancreatitis.
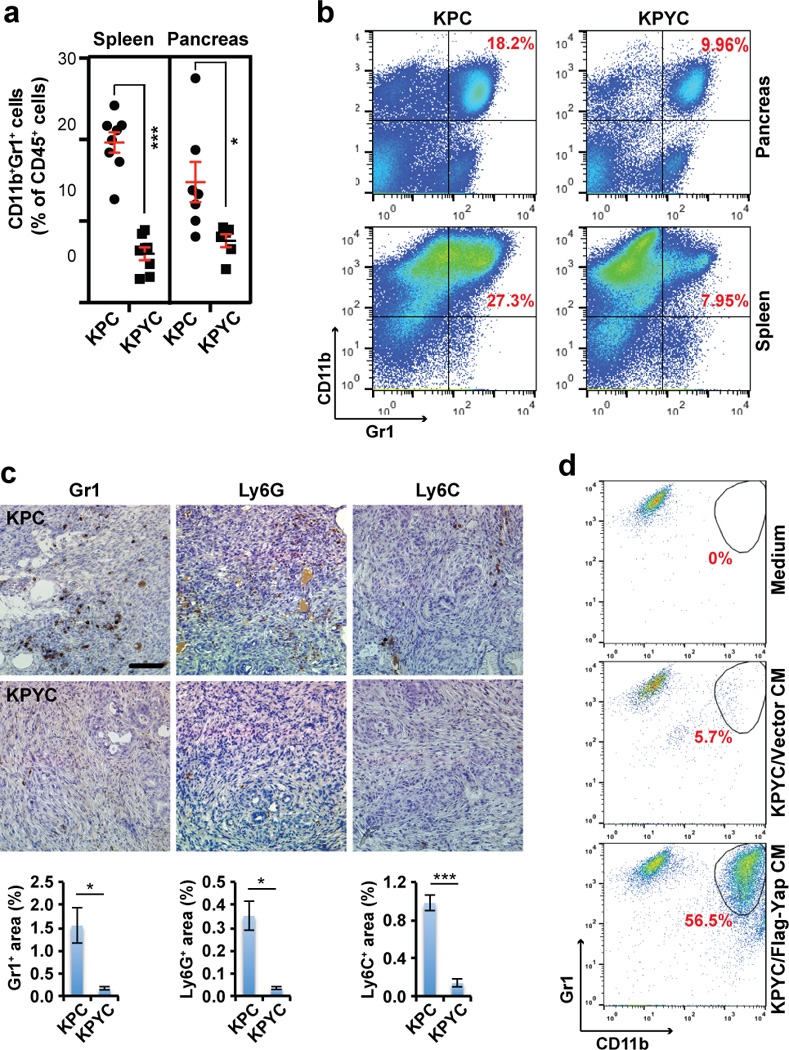
(a) Percentage of of Gr1+CD11b+ MDSC cells among total CD45+ leukocytes in spleens and pancreata from 9-week-old KPC (spleen, n = 8; pancreas, n = 7) and KPYC (spleen, n = 6; pancreas, n = 5) mice at 1 week post caerulein injections as determined by flow cytometry. Symbols represent data from individual mice, and bars show the mean. Error bars indicate standard deviations. *P<0.05; ***P<0.0005.
(b) Representative plots of flow cytometry analysis of Gr1+CD11b+ MDSC. The percentage of Gr1+CD11b+ cells among all CD45+ leukocytes is indicated in red.
(c) Representative images and quantification of the percentage of Gr1, Ly6C, and Ly6G IHC staining in pancreatic sections from 9-week-old KPC and KPYC mice at 1 week post caerulein challenge. Error bars indicate standard errors. Scale bar indicates 200 μm. *P<0.05; ***P<0.0005.
(d) Representative plots of flow cytometry analysis of Gr1+CD11b+ MDSC cells following 5 days of incubation of WT bone marrow cells with control medium or conditioned medium (CM) from KPYC cells transduced with vector control or Flag-Yap. The Gr1+CD11b+ population is gated and the percentage among all CD45+ leukocytes is indicated in red. Error bars indicate standard errors.