
Figure 5. Silencing of Yap in Kras:Trp53 mutant PDAC cells inhibits the transcription and secretion of MDSC-polarizing cytokines.
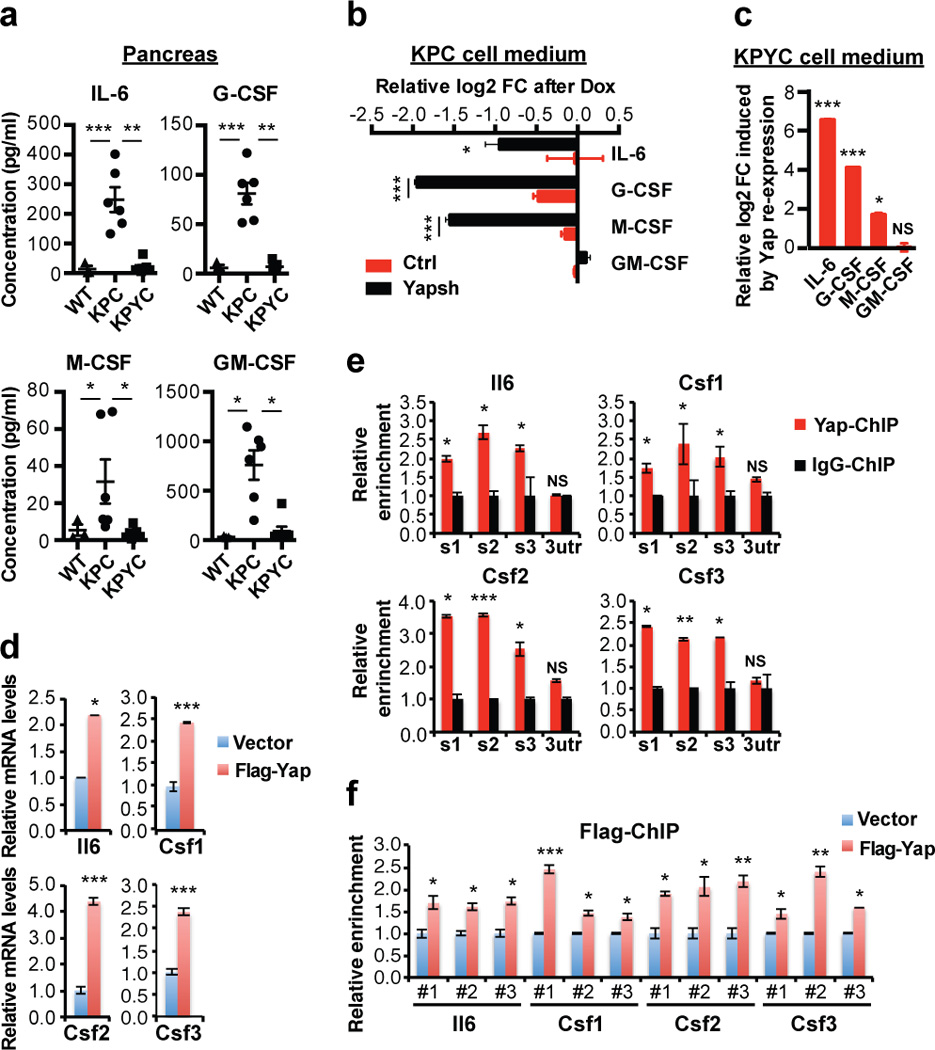
(a) Quantification of indicated cytokines in pancreata from 9-week-old WT (n = 3), KPC (n =6), and KPYC (n = 7) mice at 1 week post caerulein injection as determined by ELISA. Symbols represent data from individual mice, and bars show the mean. Error bars indicate standard deviation. *P<0.05; **P<0.005; ***P<0.0005.
(b) Relative log2 fold changes (FC) of indicated cytokines in the conditioned media (CM) of KPC PDAC cells harboring pTRIPZ empty vector (Ctrl) or pTRIPZ-shYap (Yapsh) after addition of Dox. Error bars indicate standard deviation. *P<0.05; ***P<0.0005.
(c) Relative log2 FC of indicated cytokines in the CM from KPYC cells re-expressing Yap compared to CM from KPYC control cells. Error bars indicate standard deviation. *P<0.05; **P<0.005; NS: not significant.
(d) Relative mRNA expression of indicated genes in KPYC cells introduced with vector control or Flag-Yap as determined by qRT-PCR analysis. Error bars indicate standard error. *P<0.05; ***P<0.0005.
(e) qRT-PCR analysis of ChIP with control IgG and Yap antibodies against promoter regions containing putative Tead-binding motifs (S1-3) of indicated genes in KPC PDAC cells. The 3’UTR sequences were used as negative controls. Error bars indicate standard error. *P<0.05; **P<0.005; ***P<0.0005; NS: not significant.
(f) qRT-PCR analysis of ChIP with Flag antibodies in KPYC cells introduced with control vector or Flag-Yap using the same set of primers as in (e). Error bars indicate standard error. *P<0.05; **P<0.005; ***P<0.0005.