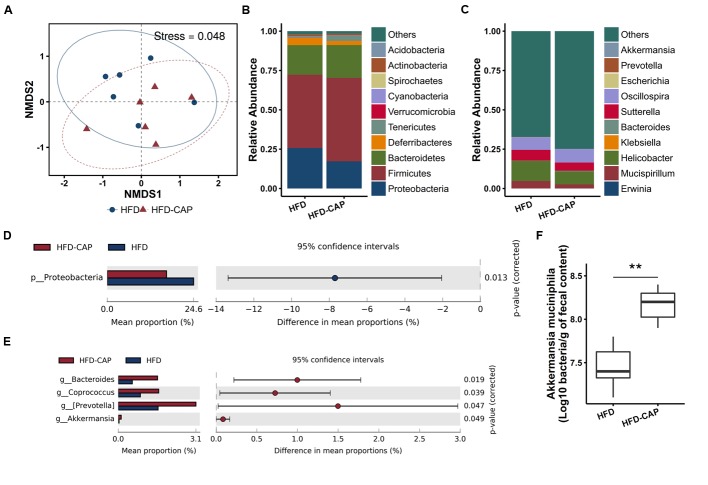
FIGURE 2.
Microbiome composition. (A) NMDS for ordination plot of normalized counts at the OTU level (stress = 0.048). (B,C) Taxonomy composition at the phylum and genus levels. The top 10 phyla/genera were reported for each group, and all others are grouped into “others.” (D,E) Taxa that differ significantly between HFD-CAP and HFD at the phylum and genus level. (F) Absolute abundance of Akkermansia muciniphila in fecal content by qPCR. ∗∗P < 0.01.

