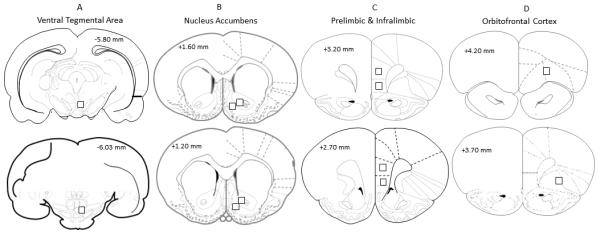
Figure 1.

Schematic representations of coronal stereotaxic sections illustrating the approximate areas for cellular analysis; VTA (Panel A), NAc core and shell (Panel B), PrL and IL portions of mPFC (Panel C) and OFC (Panel D). Black square represents the approximate section where the confocal imaging acquisition occurred. In Panel B, the more lateral square represents the core and the medial square represents the shell; in panel C, the more dorsal square represents the PrL and the ventral square represents the IL.
