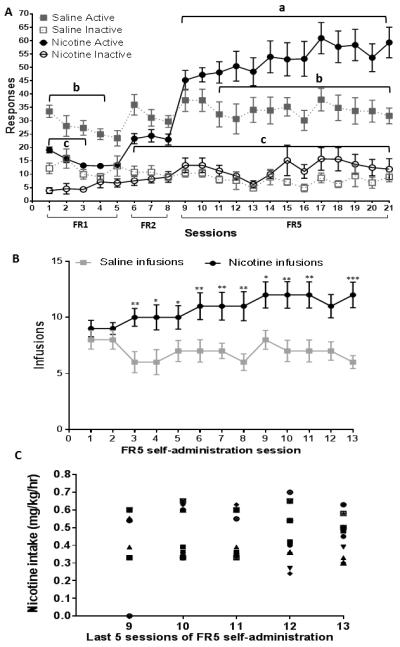
Figure 2.

Behavioral results obtained from nicotine and saline self-administration groups. A. Mean (±SEM) number of active and inactive lever responses for saline and nicotine self-administration groups across the 21 acquisition sessions. a Represents a within-group difference in active nicotine responses on sessions 9-21 compared to session 1, p<0.05. b Represents a between-group difference in active responses between saline and nicotine groups, p<0.05. c Represents a within-group difference in active and inactive responses in the nicotine self-administration group, p<0.05. B. Mean (±SEM) number of infusions across the FR5 sessions in saline and nicotine self-administration groups; *represents significant difference from saline control, *p<0.05, **represents significant difference from saline control, p< 0.01. C. Nicotine intake per session for individual nicotine self-administration rats, expressed in mg/kg during each of the last five FR5 sessions.
