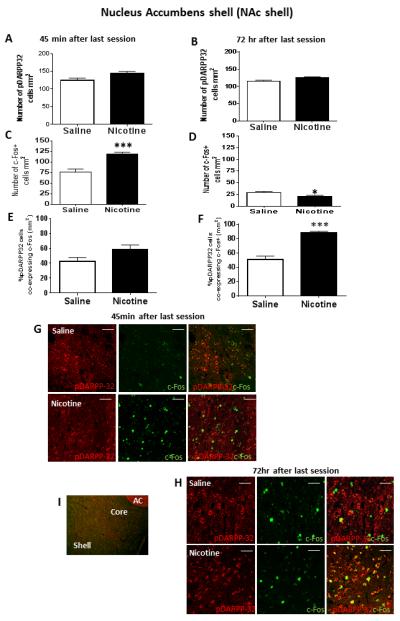
Figure 4.

In the top graph panels, immunofluorescence results from NAc shell showing the number of pDARPP-32 cells per mm2 at either 45 min (Panel A) or 72 hr (Panel B) after the last session. In the middle row of graph panels, immunofluorescence results showing the number of c-Fos+ cells per mm2 either 45 min (Panel C) or 72 hr (Panel D) after the last saline or nicotine self-administration session; *represents significant difference from saline control p<0.05, ***represents significant difference from saline control p<0.001. In the bottom row of graph panels, percentage of pDARRP-32+ cells co-expressing c-Fos at either 45 min (Panel E) or 72 hr (Panel F) after the last session; ***represents significant difference compared to saline control, p<0.001. Data represent mean+SEM. (G) Confocal microscope images showing representative fluorescent cells in NAc shell 45 min after the last session. Images show NAc cells expressing pDARPP-32 or c-Fos alone, as well as the merge showing co-expression of pDARPP-32 and c-Fos. (H) Confocal microscope images showing representative fluorescent cells in NAc 72 hr after the last session. Images show NAc cells expressing pDARPP-32 or c-Fos alone, as well as the merge showing co-expression of pDARPP-32 and c-Fos. For panels (G) and (H), scale bar represents 20 μm and images were acquired with a 20x lens with a digital zoom of 2.5x (50x). (I) Representative photoimage showing NAc shell and core subregions relative to anterior commissure (AC).
