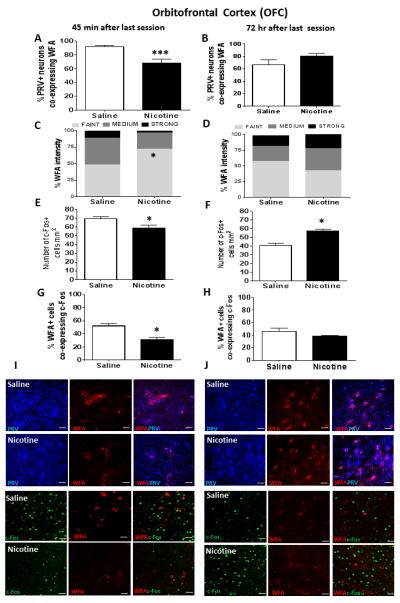
Figure 5.

In the top graph panels, percentage of PRV+ cells in OFC co-expressing WFA at either 45 min (Panel A) or 72 hr (Panel B) after the last self-administration session; ***represents significant difference compared to saline control, p<0.001. In the second row of graph panels, intensity of WFA+ labelling at either 45 min (Panel C) or 72 hr (Panel D) after the last self-administration session; *represents significant difference in percent faint intensity labelling compared to saline control, p<0.05. In the third row of graph panels, number of c-Fos+ cells/mm2 at either 45 min (Panel E) or 72 hr (Panel F) after the last self-administration session; *represents significant difference from saline control, p<0.05. In the bottom row of graph panels, percentage of WFA+ cells co-expressing c-Fos at either 45 min (Panel G) or 72 hr (Panel H) after the last self-administration session; *represents significant difference from saline control, p<0.05. Data represent mean+SEM. (I) Confocal microscopy images showing representative fluorescent cells in OFC 45 min after the last session. First two rows show PRV+ cells and WFA+ cells alone, as well as the merge showing co-expression of PRV and WFA. Bottom two rows show and c-Fos+ and WFA+ cells alone, as well as the merge showing co-expression of WFA and c-Fos. (J) Confocal images showing representative fluorescent cells in OFC 72 hr after the last session. First two rows show PRV+ cells and WFA+ cells alone, as well as the merge showing co-expression of PRV and WFA. Bottom two rows show c-Fos+ and WFA+ cells alone, as well as the merge showing co-expression of c-Fos and WFA. Scale bar represents 20 μm. Images were acquired with a 40x lens with a digital zoom of 2x (80x).
