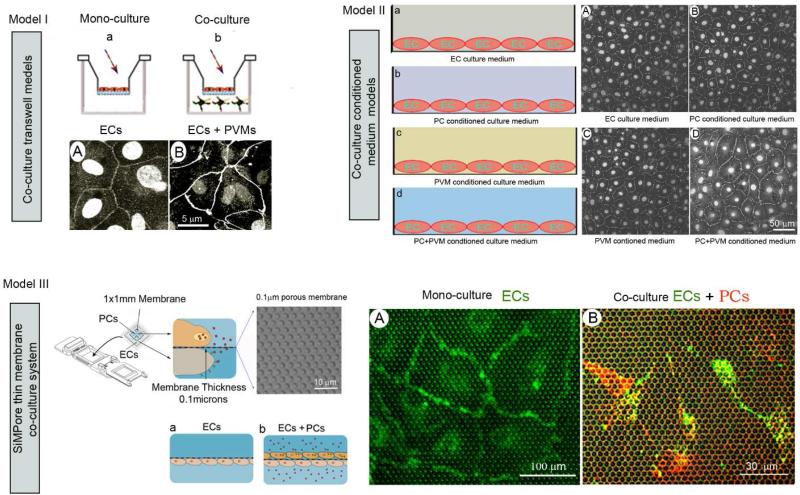
Figure 5.
The schematic illustrates several variations of the in vitro blood-labyrinth barrier model. (a) Model I shows a schematic of cells co-cultivated on a Transwell layer. Images of an EC monolayer labeled with antibody for ZO-1 are shown in both a mono-culture and co-culture setup. (b) Model II shows an EC monolayer labeled with antibody for ZO-1 and treated with different conditioning growth media. (c) Model III is a CytoVu/SiMPore thin membrane co-culture system. (d) The accompanying confocal fluorescence images show direct visualization of BSI-B4-labeled ECs on the thin membrane (left) and a population of PE-PDGFRβ–labeled PCs to one side of the thin membrane and FITC-BSI-B4–labeled ECs on the other (right).

