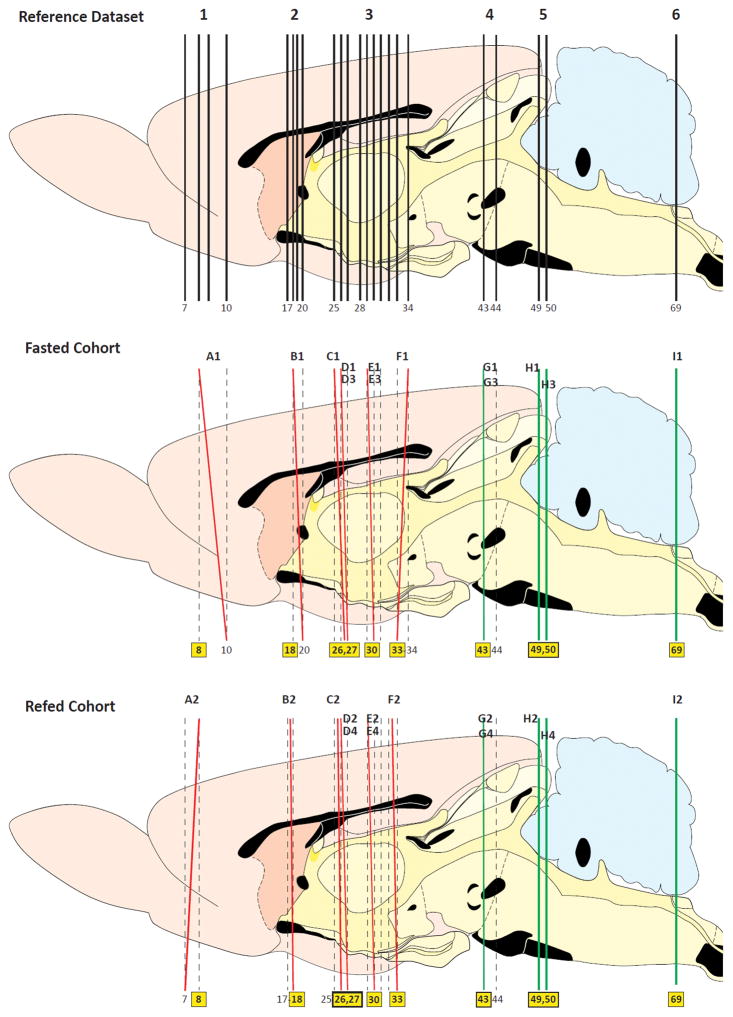
Figure 1.
Plane of section analysis for the images used to map c-Fos-immunoreactive signal to the Swanson (2004) atlas. The top panel shows a sagittal view of the Swanson reference atlas brain, with vertical lines marking the selected atlas levels used for our analysis. The middle and bottom panels show the plane of section of the tissue analyzed (red or green) with respect to the Swanson levels (black). Black alphanumeric designations (e.g., ‘A1’) correspond the appropriate panel in Figure 2 that shows the detailed map at that plane. Yellow boxes highlight the atlas levels assigned for the particular section analyzed. If a section’s plane fell between two atlas levels (i.e., there was a dorsoventral difference in plane), the plane of section is drawn as a red line. In such cases, only a portion of the section was used; the level for the portion chosen is indicated by the yellow box assignment. That portion was then used to compare against a comparable portion of a section from the other cohort. Levels completely in plane with the reference atlas are drawn as green lines.

