
FIGURE 2.
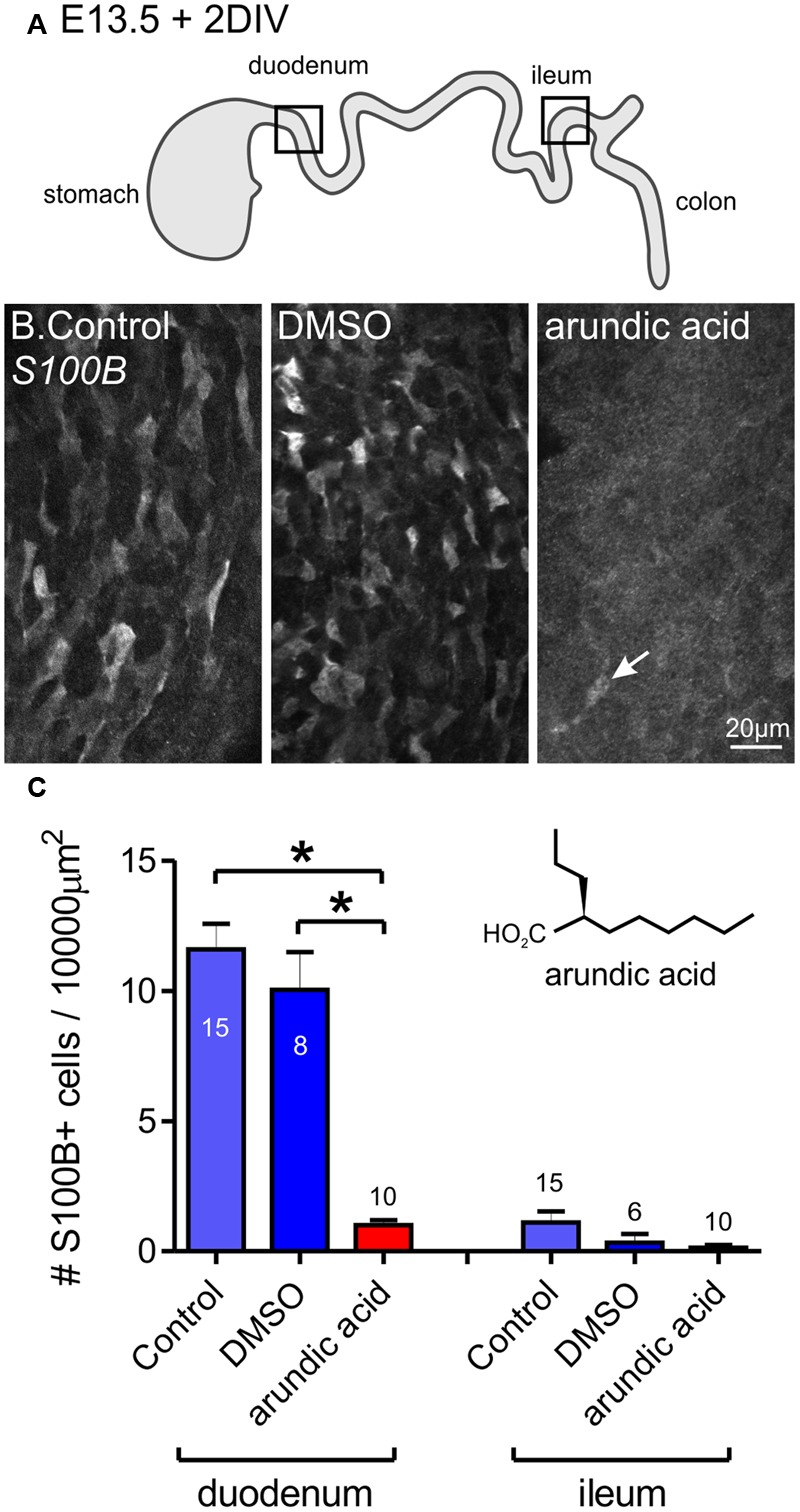
Inhibition of S100B synthesis in the ENS using arundic acid. E13.5 gut was cultured for 48 h in control media only, DMSO vehicle control, and arundic acid. (A) Diagram of the gut showing the two regions analyzed, the duodenum and ileum. (B) Representative images of S100B-immunoreactive cells in the duodenum after culture. Many cells were present in control and DSMO cultures. Very few S100B+ cells were present after culture in arundic acid (arrow). Scale bar = 20 μm. (C) The number of S100B+ cells per 10000 μm2 of gut area. In the duodenum, there was no obvious difference in the density of S100B+ cells in control and DMSO cultures. Almost no S100B+ cells were present in arundic acid cultures, which was significantly reduced compared to both control groups. ∗p < 0.0001, one-way ANOVA with Tukey post hoc test; numbers of gut preparations for each condition are shown (total S100B+ cells counted: control 571 cells; DMSO 276; arundic acid 32). In the ileum, very few S100B+ cells were observed in any of the three culture conditions (control total 49 S100B+ cells; DMSO 8; arundic acid 4). Inset shows the chemical structure of arundic acid.